Bitcoin Price Analysis: Rollercoaster Fluctuations as Key Support Faces Ultimate Test
Bitcoin oscillated between $95,850 and $96,234 in the past sixty minutes, boasting a valuation of $1.917 trillion, a global volume footprint of $47.52 billion, and a daily price spectrum stretching from $95,850 to $99,131. It now lingers 11% beneath its historic lifetime price high.
Bitcoin
The hourly chart reveals price stabilization with modest declines as bitcoin falters near pivotal resistance barriers. The relative strength index (RSI) hovers at 43, reflecting equilibrium, while the moving average convergence divergence (MACD) at -348 hints at persisting bearish tendencies. A commodity channel index (CCI) of -138 flashes a buy alert, implying temporary undervaluation, and the momentum oscillator at -5,318 tilts optimistically. Yet trepidation pervades the market, with buyers reluctant to engage at present valuations.
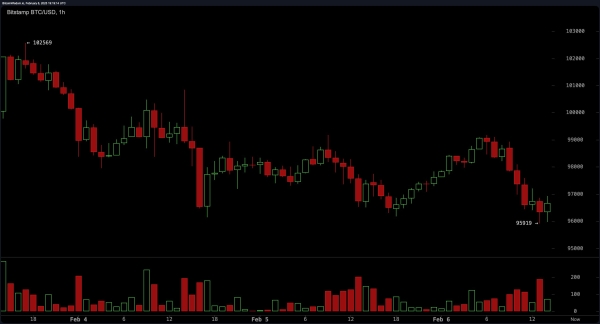 BTC/USD 1H chart on Feb. 6, 2025.
On the four-hour chart, near-term pessimism gains credence as exponential and simple moving averages (EMA/SMA) across 10-, 20-, and 30-period spans uniformly issue sell signals. The EMA (50) at 98,677 and SMA (50) at 98,717 further bolster resistance near $98,500-$99,000. Current support clings to the $95,500-$96,000 band, though a breach here might catalyze steeper declines toward $94,000. The awesome oscillator’s negative reading mirrors anemic directional thrust.
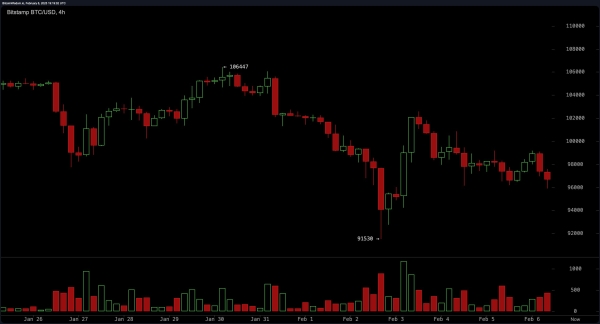 BTC/USD 4H chart on Feb. 6, 2025.
BTC’s daily analysis uncovers an extended retracement following bitcoin’s last price zenith near $109,356, with resistance anchored at $109,000-$110,000 and foundational support near $89,164. Elevated sell-side activity portends sustained downward traction unless bitcoin vaults above the symbolic $100,000 threshold. The 100-period EMA and SMA—$93,103 and $94,767, respectively—emerge as plausible safety nets, while the 200-period counterparts at $83,514 and $78,508 loom as distant floors should bearish currents intensify.
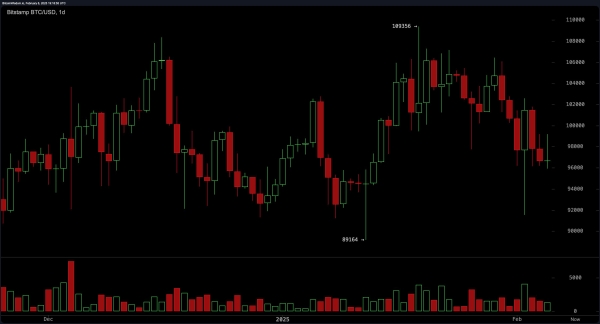 BTC/USD 1D chart on Feb. 6, 2025.
At this pivotal crossroads, BTC’s trajectory balances on a knife’s edge. Speculators anticipate a rebound from $95,000-$96,000, yet bearish threats linger should support crumble. A decisive push above $98,500-$100,000 could invigorate bullish prospects, while a slump below $94,000 may precipitate a descent toward $91,500-$92,000. The saga of supply, demand, and speculative fervor continues unabated.
Bull Verdict:
Despite recent bearish momentum, bitcoin holds key support around $95,000-$96,000, and indicators like the commodity channel index and momentum oscillator suggest potential upside if buyers step in. A breakout above $98,500-$100,000 could trigger renewed bullish momentum, reclaiming lost ground and setting the stage for a push toward $105,000-$109,000 in the coming weeks.
Bear Verdict:
Bitcoin remains under pressure, with multiple moving averages and the moving average convergence divergence reinforcing a bearish outlook. Failing to hold $95,000-$96,000 could lead to a breakdown toward $94,000, and a deeper decline below $91,500-$92,000 would confirm extended downside risks, potentially targeting the $89,000 level or lower in the near term.