Bitcoin Price Analysis: Bulls vs. Bears—Who Will Dominate the Next Move?
Bitcoin traded between $96,992 and $97,447 over the last hour on November 25, 2024, with a market capitalization of $1.92 trillion, a 24-hour trade volume of $47 billion, and an intraday price range spanning $94,119 to $97,577, reflecting a period of consolidation amid broader market uncertainties.
Bitcoin
Bitcoin‘s one-hour chart indicated short-term consolidation between $94,500 and $97,000, with low volume suggesting reduced trading activity during this range-bound movement. Key support was identified at $94,091, while resistance remained firm at $98,490. If bitcoin were to break above $97,000, it could signal renewed bullish momentum, whereas a drop below $94,500 could lead to further downside. Volume spikes during major price declines hinted at selling pressure overpowering weak recoveries.
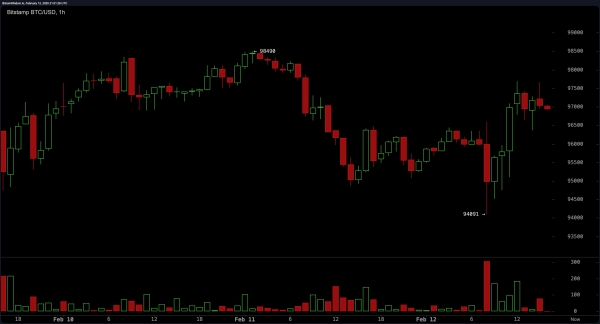 BTC/USD 1H chart via Bitstamp on Feb. 12, 2025.
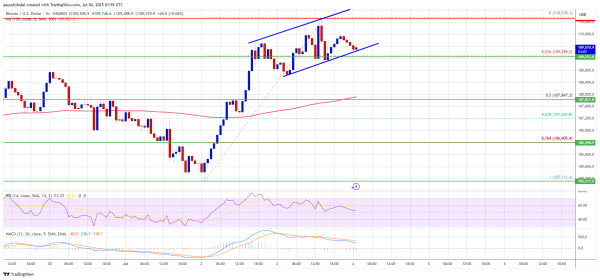
The four-hour chart reinforced the short-term bearish outlook, as bitcoin continued to struggle following its recent downtrend from $102,754. With support around $91,530 and resistance at $102,754, traders observed selling pressure intensifying near critical resistance levels. Despite brief recoveries, the lack of strong volume confirmed weak bullish attempts. A potential breakout above $97,500 could signal a shift in momentum, but failure to hold above this level may result in further declines.
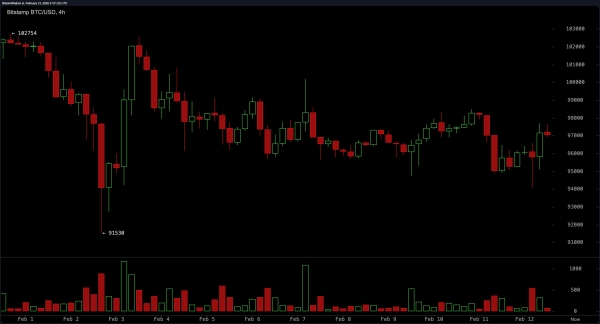 BTC/USD 4H chart via Bitstamp on Feb. 12, 2025.
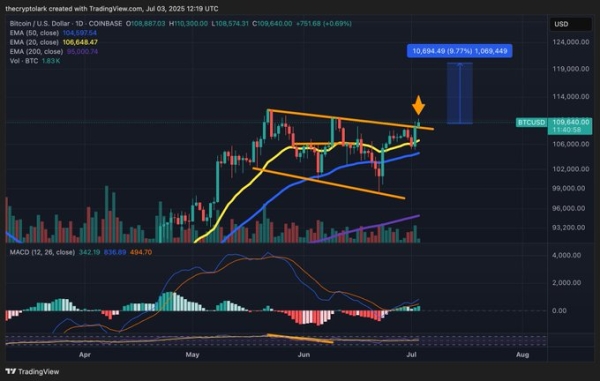
Daily chart analysis showed bitcoin consolidating within the $94,000 to $96,000 range after a larger decline from its recent high of $109,356. Key support was identified at $89,164, while resistance stood at $109,356. Volume fluctuations suggested traders were responding to major price movements, with increased activity near critical price levels. A bullish reversal would require strong volume support around the $94,000 region, whereas a drop below $92,000 could trigger further downside pressure.
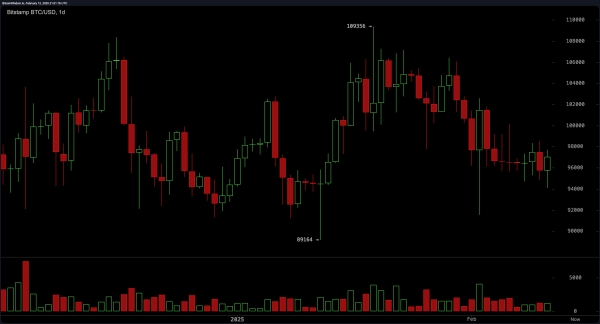 BTC/USD 1D chart via Bitstamp on Feb. 12, 2025.
Oscillators reflected mixed signals, with the relative strength index (RSI) at 45 indicating a neutral stance, while the Stochastic at 35 and the commodity channel index (CCI) at -83 also showed neutral readings. The awesome oscillator registered a negative value of -3,481, confirming weak momentum. However, the momentum indicator at -644 signaled a buy, suggesting that some traders anticipated a potential reversal. The moving average convergence divergence (MACD) level stood at -1,059, reinforcing a sell signal amid prevailing bearish conditions.
Moving averages painted a predominantly bearish picture, with the 10-period exponential moving average (EMA) at 97,499 and the 10-period simple moving average (SMA) at 97,217 both signaling sell conditions. The 20-period EMA at 98,613 and the 30-period SMA at 100,653 also indicated selling pressure. However, longer-term moving averages provided some bullish support, as the 100-period EMA at 93,498 and the 200-period EMA at 84,276 reflected stronger underlying support levels. Bitcoin’s ability to reclaim higher levels would depend on increased trading volume and a break above immediate resistance zones.
Bull Verdict:
Bitcoin’s ability to hold support above $94,000 and reclaim the $97,500 level suggests potential upside, with long-term bullish catalysts such as institutional adoption, exchange-traded fund inflows, and the upcoming halving event reinforcing a positive outlook. If bitcoin can break above the $98,500 resistance zone with strong volume, a push toward the psychological $100,000 level becomes increasingly likely, keeping the long-term bullish trajectory intact.
Bear Verdict:
Persistent selling pressure, weak volume on recovery attempts, and a failure to break key resistance levels indicate that bitcoin remains vulnerable to further downside. A break below $94,000 could trigger a drop toward $91,500, with macroeconomic uncertainty and technical indicators favoring continued bearish momentum. If bitcoin cannot reclaim $97,500 in the near term, sellers may push the price lower, extending the current corrective phase.