Bitcoin Battles $85K Resistance: Key Price Levels and RSI Signal Next Move
- Bitcoin struggles near $85K, with past rejections leading to pullbacks, while buyers attempt to hold recent gains.
- RSI trends below 60, leaving room for an upward push if buying momentum strengthens.
- A breakout above resistance could shift sentiment, setting the stage for a move toward previous highs.
Bitcoin’s price action is encountering resistance at $85,000, having rebounded from recent lows. A confirmed close above the level on a daily basis could shift resistance into support, heavily impacting future price action.
Bitcoin’s Resistance and Market Structure
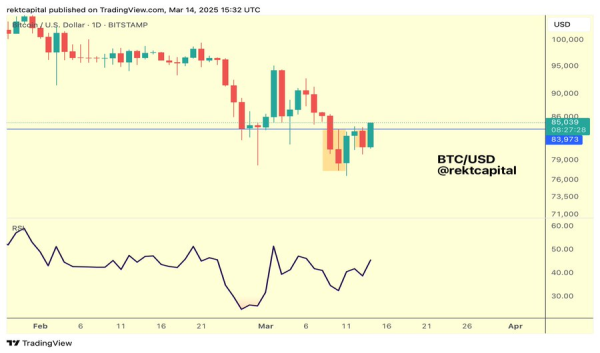
Bitcoin’s price recently pulled back, forming a sequence of red candlesticks before establishing support. A blue horizontal level has marked price interaction, historically acting as a crucial technical area. Recent candlestick formations indicate renewed buying pressure, increasing momentum and pushing Bitcoin toward resistance.
According to Rekt Capital, a weaker rejection pattern suggests resistance is losing strength. He observed that Bitcoin’s past attempts to break above $92,000 resulted in rejections, leading to market consolidation. He noted that Bitcoin’s price is currently near $83,973, with buyers attempting to hold recent gains.
 Source: Rekt Capital
Analyst Rekt stated that previous rejections at this level caused sharp pullbacks, but current price action suggests buyers are still engaged. He confirmed that Bitcoin’s ability to stay above key levels has historically led to stronger bullish continuation.
Market Reaction and RSI Analysis
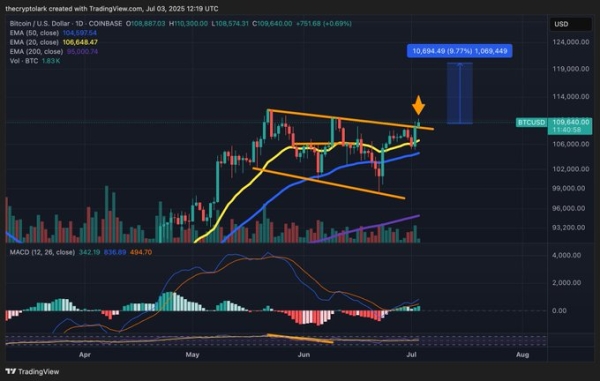
Rekt Capital stated that Bitcoin remains below key resistance. He analysed that the Relative Strength Index (RSI) trends below 60, indicating room for upward movement. He confirmed that past RSI movements above this level have supported continued bullish momentum. He noted that Bitcoin’s previous rallies gained traction when RSI crossed this threshold, making it an important breakout point.
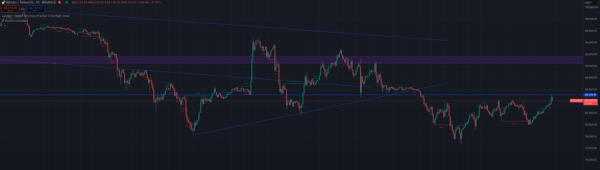
BullxBTC has highlighted additional insights into Bitcoin’s struggle to sustain gains above $85,000. He analysed that the chart structure presents a descending wedge formation pattern, characterized by lower highs and lower lows.
 Source: BullxBTC
BullxBTC shows that if Bitcoin maintains buying pressure, analysts expect a test of higher resistance zones. Market participants are closely watching Bitcoin’s price action. A confirmed breakout could signal a shift in sentiment and potential movement toward previous highs.