Expert pinpoints XRP’s turnaround zone to watch out for
Expert pinpoints XRP’s turnaround zone to watch out for 
![]() Cryptocurrency Apr 19, 2025 Share
Cryptocurrency Apr 19, 2025 Share
A cryptocurrency analyst has identified a zone just below the $2 mark that he believes could serve as a much-needed local bottom for XRP.
Specifically, pseudonymous analyst CrediBULL highlighted the $1.60 mark as a potential turning point for the asset following an extended period of consolidation, as shared in an X post on April 19.
The analysis is based on XRP’s price action and Cumulative Volume Delta (CVD) divergence, suggesting a local bottom may have formed around the $1.60 area.
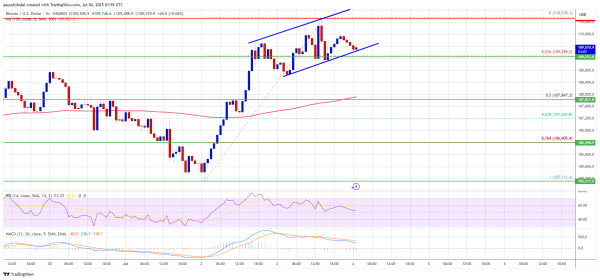
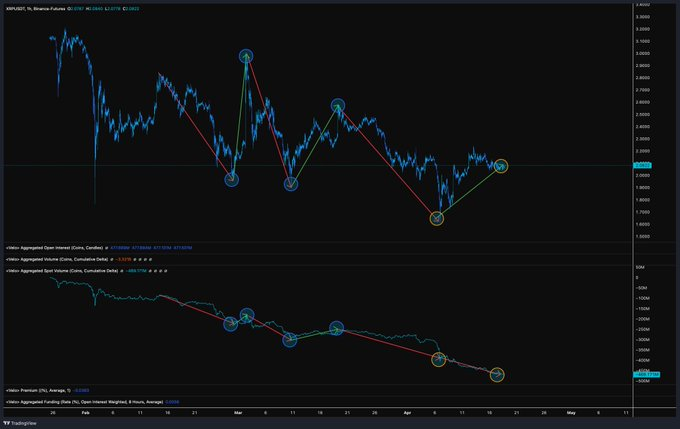 XRP price analysis chart. Source: TradingView
For the first time in weeks, price and spot CVD have started to diverge. While spot takers continue selling, typically reflected in a falling spot CVD, XRP’s price has begun to climb. This phenomenon, known as spot absorption, suggests that larger players may be stepping in to absorb sell-side pressure at a key support level.
Therefore, this marks a clear shift from previous price behavior, where XRP typically moved in sync with spot CVD. CrediBULL sees this divergence as a key signal of a potential local bottom.
The analysis also pointed to a completed corrective phase, with the latest upward move starting from the $1.60 “buy zone.”
However, the bullish setup remains fragile and depends on broader market conditions. In this line, a drop in Bitcoin’s (BTC) price could still disrupt XRP’s recovery.
XRP price to exit consolidation
It’s worth noting that XRP currently remains in a consolidation phase, in line with broader market sentiment. In this context, pro-XRP analyst Dark Defender noted that technical indicators suggest the stalled price movement might be nearing its end.
In an X post on April 18, the expert stated that XRP is approaching the final stage of its consolidation within the broader monthly structure, with price action tightening near a descending resistance trendline between $2.22 and $2.30. A breakout above this level could confirm the start of a strong impulsive move.
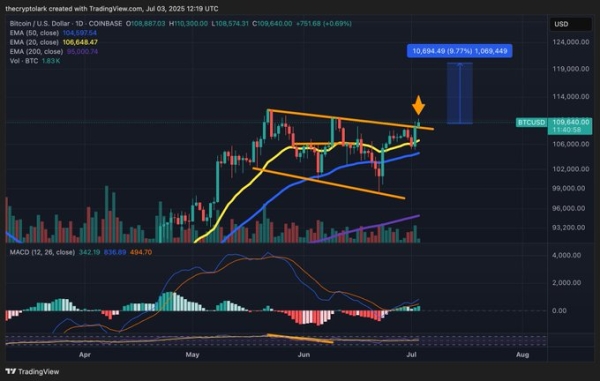
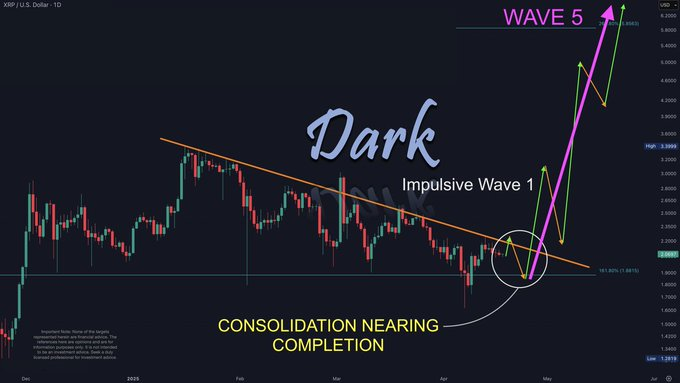 XRP price analysis chart. Source: Dark Defender
At the current price, XRP’s support levels are at $1.88 and $1.63, while projected targets are $3.75 and $5.85, assuming the consolidation phase concludes.
Meanwhile, XRP is experiencing consolidation, a time when the asset has seen increased whale activity, amid growing speculation about regulators’ potential approval of a spot XRP exchange-traded fund (ETF).
XRP price analysis
By press time, XRP was trading at $2.08, having gained nearly 0.3% in the last 24 hours. On the weekly chart, the asset is also up 0.6%.
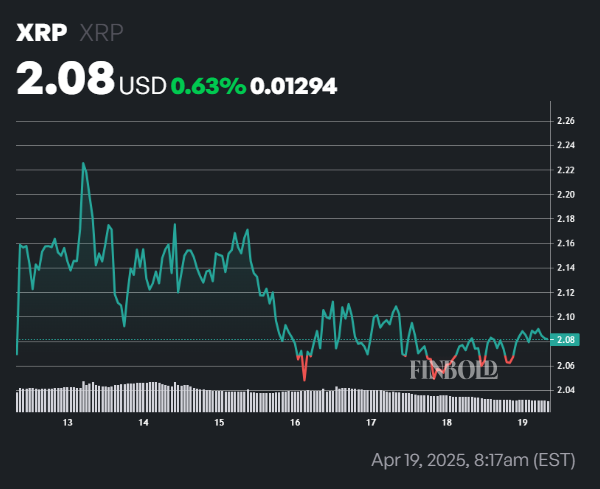 XRP seven-day price chart. Source: Finbold
Technically, the token is trading below its 50-day simple moving average (SMA) of $2.26 but remains above its 200-day SMA of $1.89, indicating a mixed trend – bullish in the long term but facing short-term resistance.
Finally, the 14-day relative strength index (RSI) stands at 47.90, which is near the neutral zone, indicating neither overbought nor oversold conditions.
Featured image via Shutterstock