Bitcoin Price Watch: Bulls Target $100K After Breakout Surge
Bitcoin traded between $96,869 and $97,057 over the last hour, maintaining a tight range near recent highs. With a 24-hour intraday range of $95,925 to $97,341, the leading cryptocurrency boasts a $1.92 trillion market capitalization and a 24-hour trading volume of $27.81 billion, signaling sustained investor interest.
Bitcoin
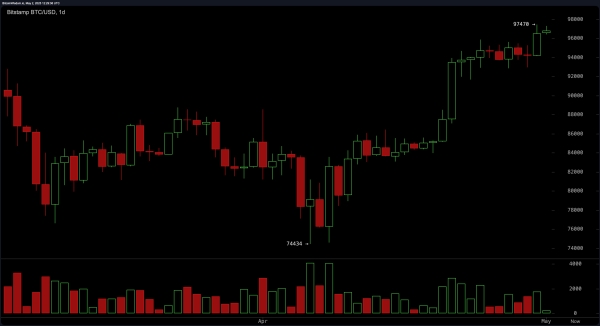
The daily BTC/USD chart reflects a strong bullish breakout from the earlier $74,000 to $84,000 consolidation zone. This breakout, followed by a surge to $97,470, is reinforced by increased buying volume, indicating robust market support. Price action shows potential for a continuation pattern, possibly an ascending triangle that predated the breakout. Current support lies around $88,000 with immediate resistance near $97,500. Technicians suggest that a pullback to the $90,000–$92,000 range could provide a lower-risk long entry, with a short-term target at $97,500 and a medium-term goal of $100,000.
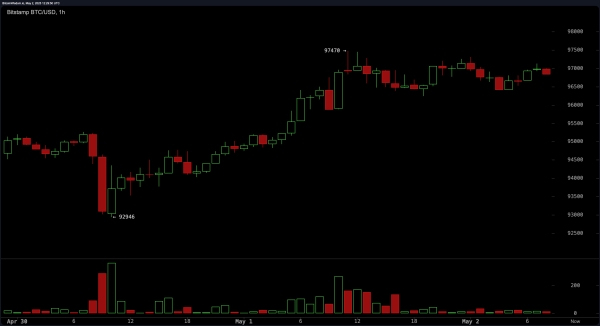
 BTC/USD 1H chart via Bitstamp on May 2, 2025.
On the 4-hour BTC/USD chart, the trend remains bullish, underpinned by a sequence of higher highs and higher lows. A micro-support zone at $94,000–$95,000, previously resistance, has now turned into support. Volume spikes on upward moves combined with quieter pullbacks present a constructive pattern. A small cup-and-handle formation prior to the move to $97,470 further supports the bullish outlook. A retest of the $95,000 zone, if accompanied by low-volume selling, offers a potential entry with targets around $97,500 or higher if momentum sustains.
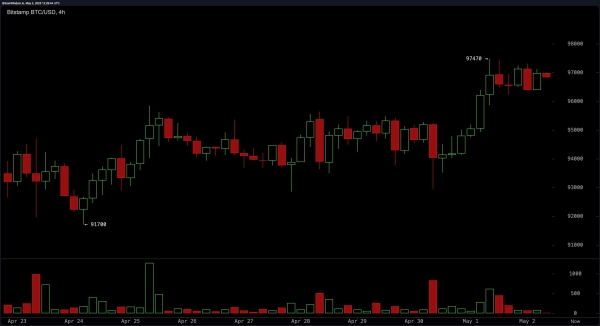 BTC/USD 4H chart via Bitstamp on May 2, 2025.
The 1-hour chart illustrates a sharp V-shaped recovery from a recent low at $92,946, suggesting a bear trap and renewed upward strength. Bitcoin now consolidates within a tight $96,500 to $97,500 range. The declining volume in this consolidation hints at a possible imminent breakout. An aggressive strategy involves buying a confirmed breakout above $97,500 with volume support, targeting $99,000 to $100,000. A prudent stop-loss could be set just below $96,000.
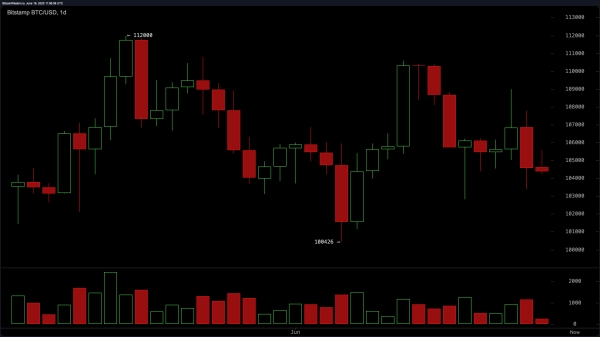
 BTC/USD 1D chart via Bitstamp on May 2, 2025.
Oscillator data is largely neutral, reflecting a market in equilibrium but leaning bullish. The relative strength index (RSI), Stochastic, commodity channel index (CCI), and average directional index (ADX) all post neutral readings. The awesome oscillator and moving average convergence divergence (MACD) signal a buy, while the momentum indicator suggests caution with a sell signal. This mixed setup highlights the need for volume confirmation before significant entries.
All major moving averages (MAs) from short- to long-term—both exponential moving average (EMA) and simple moving average (SMA)—are flashing buy signals. The exponential moving averages at 10, 20, 30, 50, 100, and 200 periods, as well as their simple moving average counterparts, all trend upward. This reinforces the strong bullish structure in both short- and long-term perspectives. Traders are advised to monitor volume and resistance at $97,500 for confirmation of the next major move.
Bull Verdict:
The technical landscape for bitcoin remains decisively bullish. With consistent buy signals across all major moving averages, a strong breakout on the daily chart, and resilient volume patterns, the path toward the psychological $100,000 level appears well-supported—provided price can clear the $97,500 resistance with conviction.
Bear Verdict:
Despite the bullish setup, bitcoin faces critical resistance at $97,500 and mixed oscillator signals that hint at potential exhaustion. A failure to break above this level, especially on declining volume, could trigger a reversal toward the $94,000–$92,000 support zone, exposing the market to a deeper corrective phase.