Here’s Bitcoin’s path to $250,000 by Q4, according to expert
Here’s Bitcoin’s path to $250,000 by Q4, according to expert 
![]() Cryptocurrency Jul 12, 2025 Share
Cryptocurrency Jul 12, 2025 Share
Bitcoin’s (BTC) ongoing bullish run shows no signs of slowing, with an analyst projecting that the asset could reach $200,000 by 2025.
To this end, trading expert Michaël van de Poppe forecasts that Bitcoin will reach a record high of $250,000 by Q4 2025, according to his July 11 post on X.
He expects the maiden digital asset to reach $125,000 in July, climb to $150,000 by the end of the quarter, and ultimately target $250,000 by year-end.
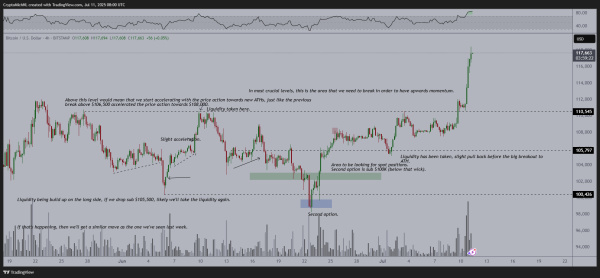
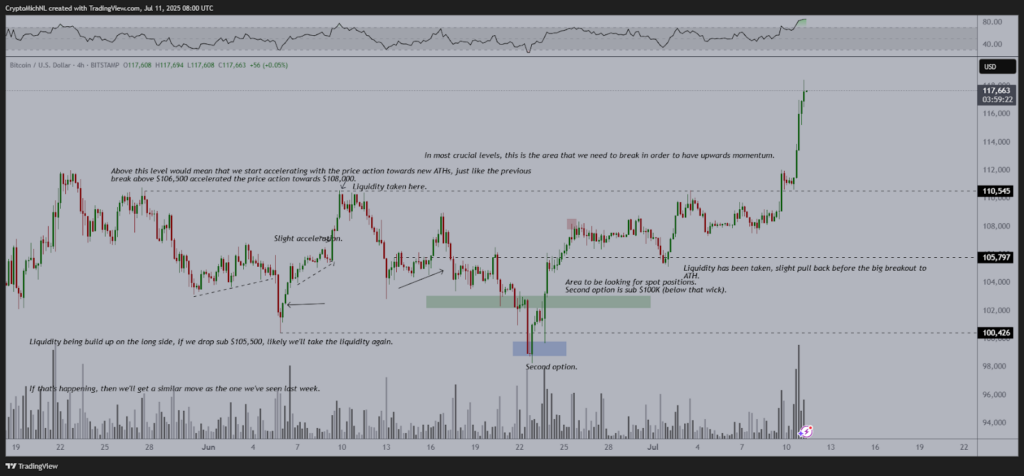 Bitcoin price analysis chart. Source: TradingView
Poppe’s outlook is guided by Bitcoin’s ability to break decisively above the $110,000 and $112,000 resistance zone, which had capped previous rallies.
He noted that late June saw liquidity sweep below $105,000, followed by accumulation around $100,400 and $105,000, paving the way for the breakout. The recent move above $110,000 was accompanied by rising volume, indicating strong buying momentum.
While a short-term pullback is possible as liquidity above $112,000 is absorbed, Poppe sees $125,000 and $150,000 as near-term targets, with a potential parabolic run to $250,000 if these levels give way.
Key Bitcoin price levels to watch
Separately, pseudonymous analyst BitBull, in a July 12 X post, echoed similar targets. He noted that after breaking $117,000, Bitcoin could push toward $120,000 in the coming days, followed by a period of consolidation.
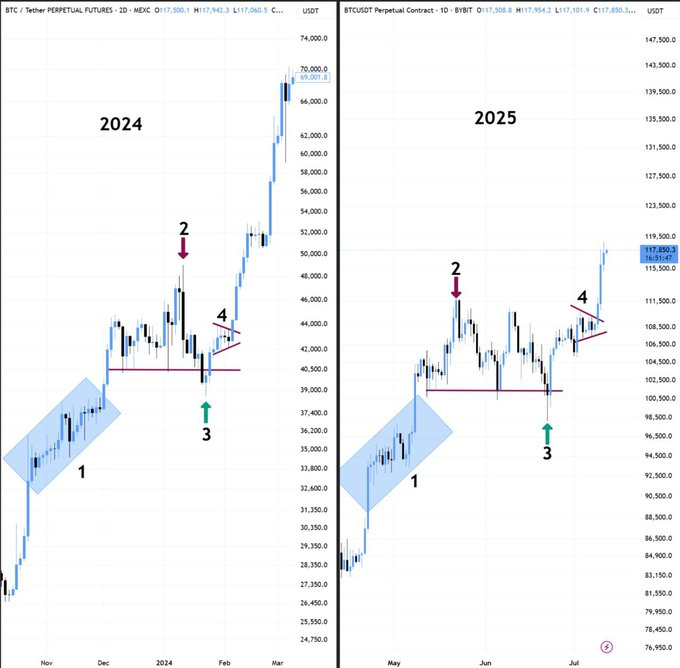 Bitcoin price analysis chart. Source: BitBull
This pattern, he said, resembles February 2024, when Bitcoin paused after a sharp rally, giving altcoins room to catch up before resuming its climb. BitBull projects Bitcoin could then advance to $135,000 and $140,000, marking a potential local top.
Bitcoin price analysis
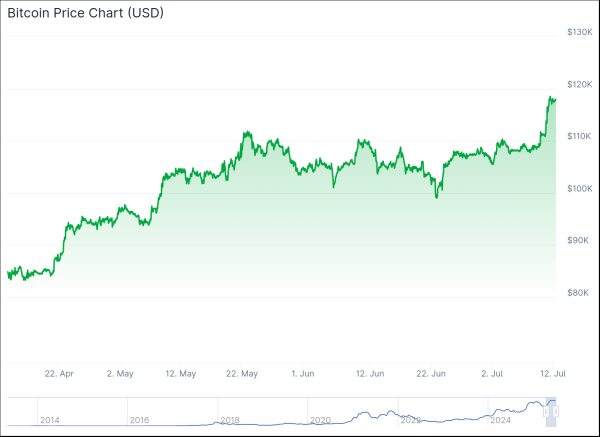
At the time of writing, Bitcoin was trading at $117,810, representing a gain of more than 8% over the past week.
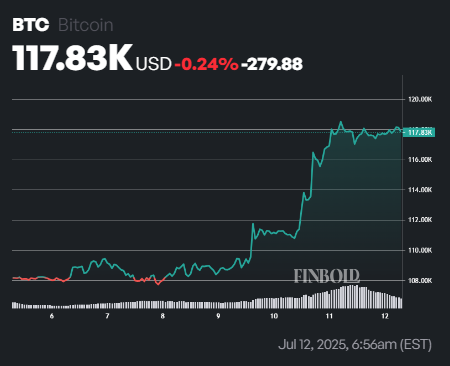 Bitcoin price chart. Source: Finbold
Technically, Bitcoin remains bullish, trading well above the 50-day simple moving average (SMA) at $106,967 and the 200-day SMA at $88,448. However, the 14-day relative strength index (RSI) at 72.85 signals overbought conditions, suggesting the risk of a near-term pullback if momentum cools.
Featured image via Shutterstock