This Bitcoin price chart should cheer all of BTC bulls
Bitcoin (BTC) price has remained in a holding pattern in the past two weeks as it continued to underperform American equities, which had their best week in over nine months.
Bitcoin has been stuck between the support at $57,000 and the resistance point at $62,000 while the Dow Jones, Nasdaq 100, and S&P 500 indices are within touching distance to their all-time highs.
Therefore, as always, some investors believe that Bitcoin may be about to stage a strong bearish breakout as we saw after its strong rally in 2021. However, a closer look at the coin’s charts show the opposite.
Bitcoin monthly chart analysis

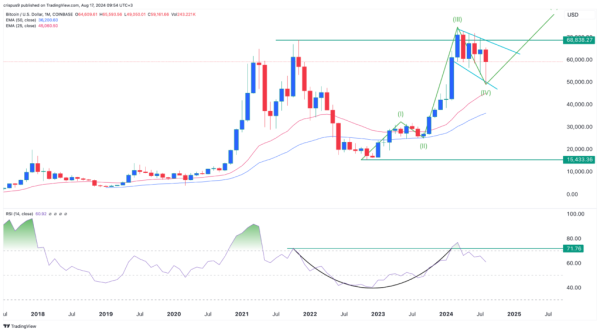
Turning to the monthly chart, we see three important things. First, despite the recent performance, Bitcoin has remained above the 50-week and 25-week Exponential Moving Averages (EMA), meaning that bulls are still in control.
This view -sort of – invalidates the death cross that has happened on the daily chart. Besides, that cross happened as the 50-day and 200-day Simple Moving Average (SMA) indicators made a bearish crossover.
While the SMA is a good indicator, it has its drawbacks since it takes all periods equally. Instead, the EMA indicator removes this noise and lag by focusing on the most recent periods.
The other important thing is that Bitcoin is in the process of forming a hammer candlestick pattern. It has already formed one on the weekly chart and the same thing is happening on the monthly.
The hammer candlestick pattern is made up of a long lower shadow and a small body. In some instances, this pattern might have a small upper shadow but in most cases it does not. Hammer is one of the most bullish signs in the market.
Additionally, Bitcoin has formed a falling channel pattern, which is important for two main reasons. First, this pattern has a feel of a falling wedge, which is another popular bullish reversal sign.
Bitcoin cup and handle pattern
Second, and this is the most important one, is that this pullback is part of the handle section of the cup and handle pattern.
Let’s look back. Bitcoin jumped to a record high of $68,838 in 2021 and then retreated and bottomed at $15,433 in 2022 after FTX imploded. It then bounced back, and between September last year and March, rose for seven consecutive months.
During that rebound, Bitcoin completed the cup section of the cup and handle pattern. As such, the current pullback is part of the handle section. Therefore, there is a likelihood that Bitcoin will ultimately bounce back and move to a record high.
The Relative Strength Index (RSI), has also formed a similar cup and handle pattern on the monthly chart.
That’s not all. The monthly chart also shows that Bitcoin has formed what looks like a perfect impulse Elliot wave pattern. The first phase happened in early 2023 while the second phase took place between May and September last year.
The third wave, which is often the most bullish, took place between September and March and is now in the fourth one. Therefore, there is a likelihood that the coin will enter the fifth wave, which is often highly bullish.
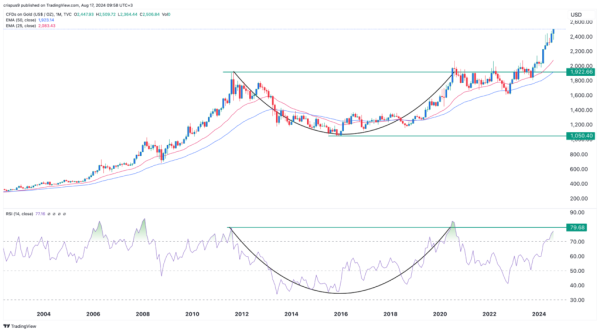
Now, there’s a caveat about all these patterns: they take time. For example, even for a basic chart pattern like the hammer, we need Bitcoin to end the month in this range for it to work out. As you will see below, gold’s cup and handle pattern took years to form.
Bitcoin price mirrors that of gold

We have seen the cup and handle chart pattern work perfectly before. On the chart above, we see that gold jumped to a record high of $1,922 in 2011 and then retreated to a low of $1,050 in 2015.
Gold then bounced back and retested that level in 2020. It then consolidated between July 2020 and November last year and then broke out. The Relative Strength Index also formed a cup and handle pattern in that period. Gold has now soared to a record high of $2,500.
There will be several potential catalysts for the Bitcoin price in the next few years. First, Donald Trump wants to make the Federal Reserve less independent, a move that would lead to a sharp decline of the US dollar. We have seen that happen with the Turkish lira, which has imploded. Bitcoin does well when the dollar is falling.
Second, the Federal Reserve is set to start cutting interest rates in the next meeting in September now that the unemployment rate has soared to a record high. As we saw in 2021, Bitcoin and other assets thrive in a low-interest-rate environment.
Further, there are signs that institutions are loading up on gold. Goldman Sachs has bought Bitcoin ETFs worth millions of dollars. The same is true with institutions like Susquehanna and Millenium Management.
NEW: 🇺🇸 Major banks buying #Bitcoin ETFs-
$2.8 trillion Goldman Sachs
$1.4 trillion Morgan Stanley
$600 billion Wells FargoAre you paying attention? 🚀 pic.twitter.com/eDEwtw0asp
— Bitcoin Magazine (@BitcoinMagazine) August 14, 2024
The post This Bitcoin price chart should cheer all of BTC bulls appeared first on Invezz


