Trading expert highlights Solana’s (SOL) ‘best entry’ price target
Trading expert highlights Solana’s (SOL) ‘best entry’ price target 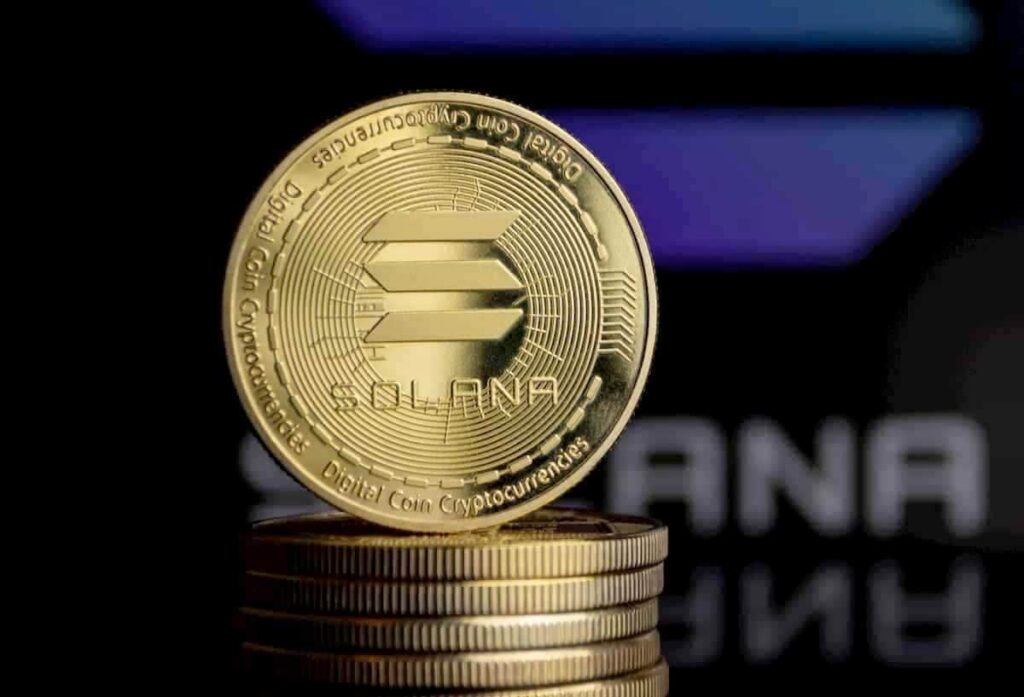
![]() Cryptocurrency Sep 1, 2024 Share
Cryptocurrency Sep 1, 2024 Share
Solana (SOL) has been consolidating in a six-month downtrend range close to its all-time high (ATH) from 2021. As the cryptocurrency loses momentum from the impressive 2023 rally, trading experts weigh in on the “best entry” price target.
In particular, FieryTrading posted a long-term technical analysis on TradingView this Saturday, August 31, highlighting his entry price target. According to the trader, he is “waiting for the best entry” in a “bullish triangle” chart pattern dating from 2021.
The triangle had its bottom at $1.0 per SOL on December 21, 2020, with three following higher lows. First, at $8.15 in December 2022, followed by June and September 2023’s $13 and $17, making historical ideal entry points.
Picks for you
Economist reveals the Fed's 'biggest policy error ever' 30 mins ago Will the ‘September Effect’ impact Bitcoin price this year? 19 hours ago Long bear market alert if Bitcoin stays under this key price level 21 hours ago Is the Gold standard coming back? 21 hours ago
FieryTrading believes Solana may visit the bullish triangle’s support soon, projecting a price target of around $71 by January 2025. Nevertheless, his “best entry” point may happen sooner or later, adjusting the price target accordingly to the support‘s uptrend.
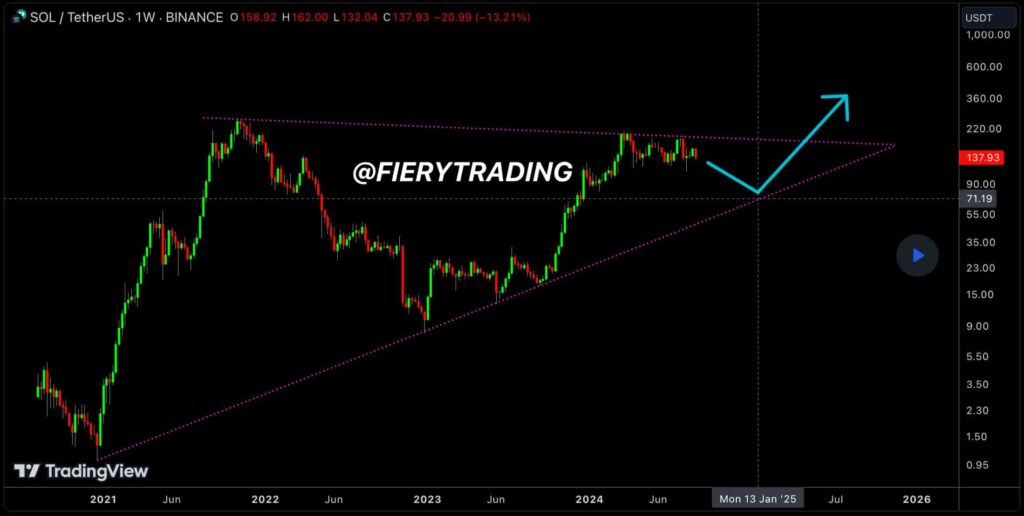 Solana (SOL) weekly price chart. Source: TradingView / FieryTrading
Solana’s bullish triangle could backfire on its entry price target
On the other hand, the triangle is also made of lower highs, forming a downtrend from Solana’s all-time high. The token touches the pattern’s resistance again in July at $191 after failing to break it for four subsequent weekly candlesticks from March to April.
Interestingly, SOL’s current local top at $210 still represents a larger market capitalization than the $260 ATH. Data from TradingView shows a $80.96 billion market cap at $260 versus $93.13 billion at $210. This is due to Solana’s significant supply inflation, which directly affects the unitary price potential while facing a similar demand.
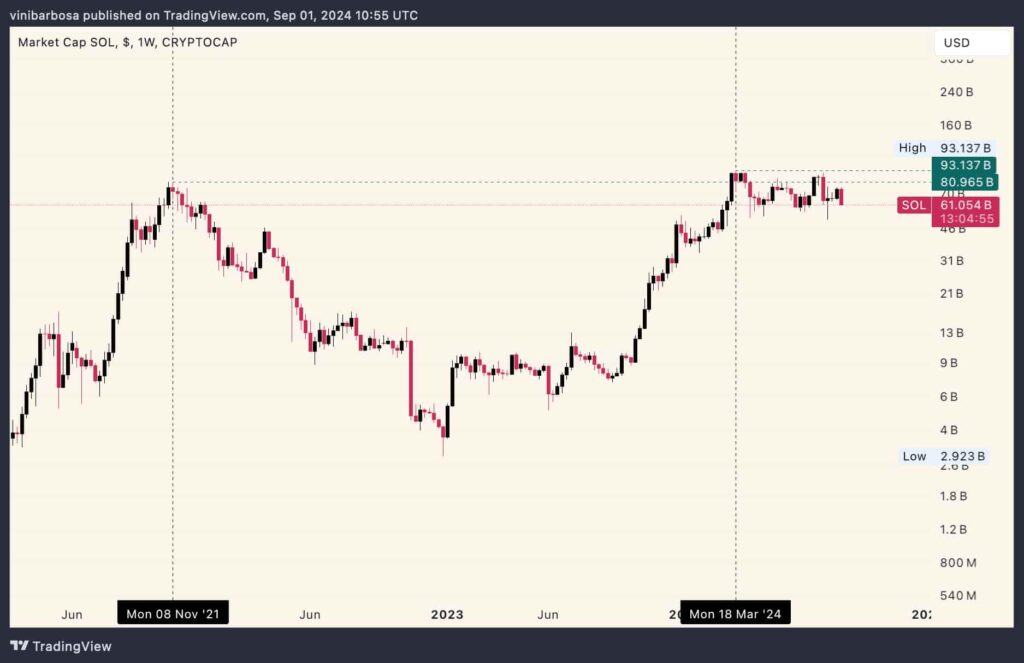 Solana (SOL) weekly market cap chart. Source: TradingView / Finbold
The trading expert explains that after reaching a new local bottom within the triangle’s support, SOL will likely bounce up to its resistance again – ideally breaking out for a bull run and price discovery, seeking a new all-time high.
However, Solana could still surprise the market, breaking out downwards as it approaches the triangle’s breaking point. SOL will need a remarkably higher demand in order to beat its supply inflation and fight for new highs.
Traders and investors must closely watch the ecosystem’s development and demand signals to evaluate their chances and make financial decisions. Cryptocurrencies are highly volatile assets, and predicting their price activity is challenging even for trading experts.
Disclaimer: The content on this site should not be considered investment advice. Investing is speculative. When investing, your capital is at risk.
