Bitcoin’s dip ‘may keep dipping’ if this trendline is not breached, says analyst
Bitcoin’s dip ‘may keep dipping’ if this trendline is not breached, says analyst 
![]() Cryptocurrency Sep 4, 2024 Share
Cryptocurrency Sep 4, 2024 Share
Bitcoin’s (BTC) bulls are under pressure as they attempt to minimize the downward trajectory of the maiden cryptocurrency amid a general market sell-off.
Focusing on how Bitcoin might navigate the current conditions, cryptocurrency analyst Ali Martinez, in an X post on September 4, pointed out that based on technical indicators, the asset faces the potential for further losses.
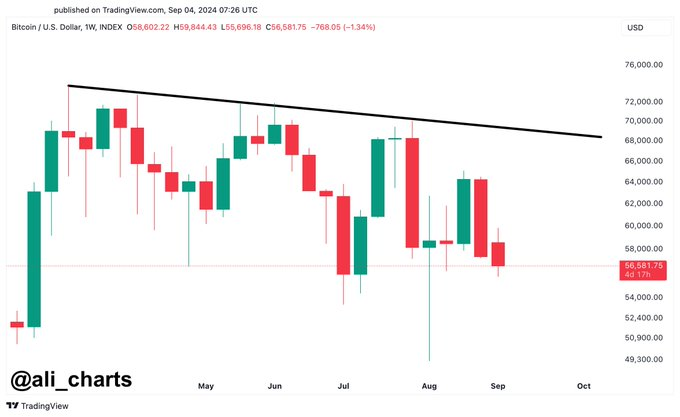
Martinez noted that investors should anticipate a possible drop in Bitcoin’s price if the asset fails to breach a key trendline around the $68,000 mark.
Picks for you
Bitcoin is ready for a bullish reversal: ‘This time could be different’ 16 mins ago Why is Michael Saylor not buying Bitcoin lately? 2 hours ago Donald Trump regains popularity against Kamala Harris on prediction markets 3 hours ago FAssets Open Beta adds Bitcoin support 3 hours ago  Bitcoin price analysis chart. Source: TradingView/Ali Charts
Indeed, the expert illustrated the significance of this trendline on Bitcoin’s weekly timeframe. Since April 2024, Bitcoin has emerged from several lower highs, with the formidable barrier at $68,000.
“If you’re a Bitcoin breakout trader, this is the main trendline you should be worried about, currently at $68,000! Until this breaks, the $BTC dip may keep dipping,” Martinez said.
In this context, Bitcoin has faced challenges in breaking above the descending trendline, which several failed breakout attempts have marked. Additionally, the analysis highlighted that Bitcoin has experienced a series of lower highs and lower lows, indicating persistent bearish sentiment in recent months.
Bitcoin targeting $180,000
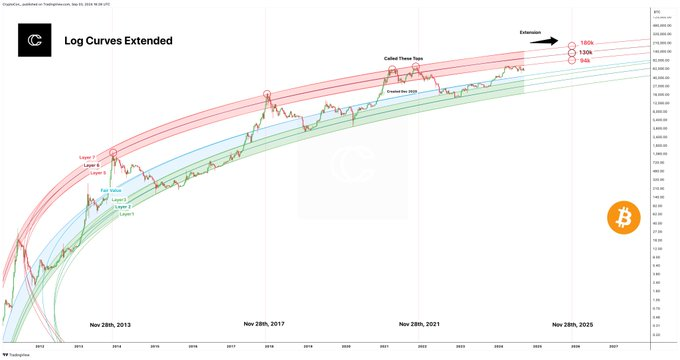
Overall, some market analysts maintain that despite short-term volatility, Bitcoin is on track to reach an all-time high in the coming months. Notably, in an X post on September 3, Crypto Con predicted a potential price target of up to $180,000 by the end of 2025.
This projection is based on extended logarithmic curves, where ‘Layer 7’ presents the most bullish scenario in the model. This model has accurately predicted Bitcoin’s peaks in previous cycles, including in 2021.
 Bitcoin price analysis chart. Source: TradingView/Crypto Con
According to Crypto Con, the sideways price action observed over the past six months has caused uncertainty and fear among traders and investors, particularly after the launch of Bitcoin exchange-traded funds (ETF). However, the analyst emphasized that this period of stagnation should not be mistaken for the end of the crypto rally.
“If you’ve been here since the beginning of the cycle you’ve held through black swan predictions, many calls for a recession (that never came), and now two gruesome sideways periods. You’re almost to the fun part, Red Year 2025 is next,” the expert noted.
Overall, it will be interesting to monitor how Bitcoin performs in September, a historically bearish month. Notably, the month is riddled with significant macroeconomic developments, especially the anticipated Federal Reserve interest rate cut and its impact on risk assets such as Bitcoin.
Bitcoin price analysis
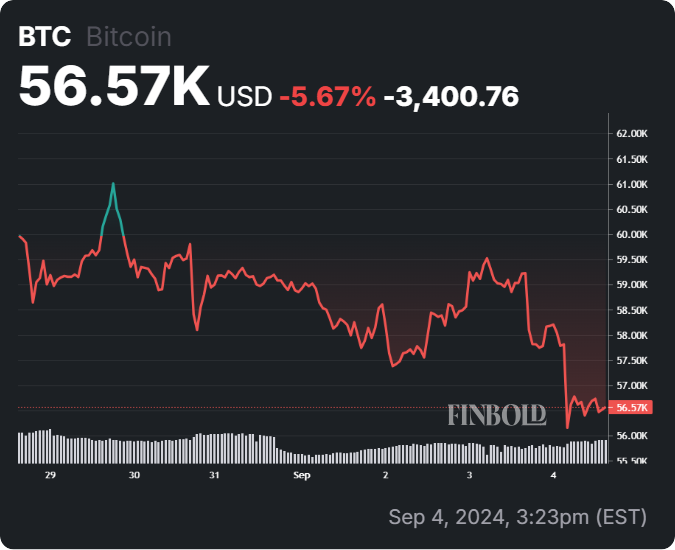
At press time, Bitcoin was trading at $56,570, having experienced a daily decline of over 4%. On the weekly chart, BTC is down 5.6%.
 Bitcoin seven-day price chart. Source: Finbold
Although Bitcoin is showing bearish sentiment in the short term, reaching the critical trendline of $68,000 seems like an uphill task. Therefore, Bitcoin must clear immediate barriers to reclaim the $60,000 resistance while avoiding a plunge below $55,000.
Disclaimer: The content on this site should not be considered investment advice. Investing is speculative. When investing, your capital is at risk.


