Bitcoin price levels to watch as ‘bullish fervor’ set to ‘cool down very quickly’
Bitcoin price levels to watch as ‘bullish fervor’ set to ‘cool down very quickly’ 
![]() Cryptocurrency Sep 21, 2024 Share
Cryptocurrency Sep 21, 2024 Share
With Bitcoin (BTC) experiencing a price rally partly triggered by the Federal Reserve’s interest rate cut, a cryptocurrency analyst is warning that the momentum might be short-lived.
In this case, Bitcoin is approaching key price levels, as market momentum could shift triggered by technical factors and upcoming economic events, RLinda observed in a TradingView post on September 21.
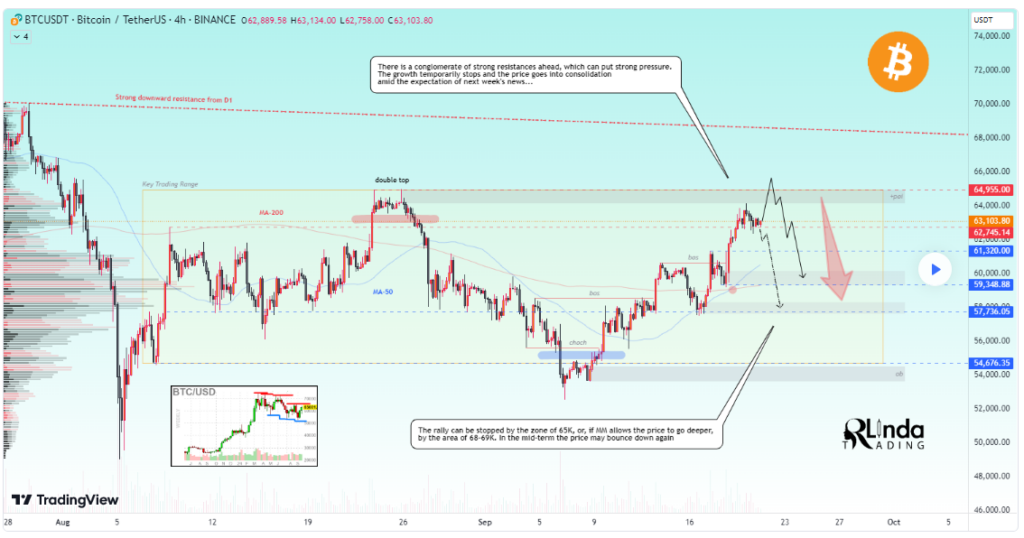
While highlighting how this momentum might stall, the trading expert raised concerns about the “conglomeration of strong resistances” between the $64,000 and $65,000 price range, which could create a roadblock. The analysis highlighted that this zone, which has yet to be fully tested, could halt Bitcoin’s advance.
Picks for you
3 cryptocurrencies to turn $100 into $5,000: ‘Sell your watch’ 45 mins ago OpenAI o1 builds ideal crypto portfolio for the 2024 bull run 3 hours ago Altseason is 'around the corner' to reward 'dumb bulls' more than 'smart bears' 5 hours ago Investor predicts crypto to $10 but dumps millions below $4 – Why? 8 hours ago  Bitcoin price analysis chart. Source: TradingView/RLinda
Further resistance is expected from $68,000 to $69,000, increasing the chances of a stall in upward momentum. RLinda noted that the current price action shows a double top formation, a potential signal that the rally may be running out of steam.
While Bitcoin’s global outlook on the higher timeframes remains somewhat bullish, showing potential for continued growth, the local view is less optimistic. In the shorter term, RLinda stated that Bitcoin seems to be facing increasing pressure as it nears the critical resistance zones.
This divergence between the global and local outlooks creates uncertainty, particularly as traders eye key economic reports due next week. Economic events, such as a speech from the Federal Reserve chair, could significantly influence market sentiment. The experts stated that the current “bullish fervor” may evaporate quickly if these indicators offer surprises.
“Trades may get nervous ahead of next week’s new news: SP PMI, DGP, DGO and Fed chief’s speech. If the indicators become sharply unpredictable, all the speculators’ bullish fervor may cool down very quickly and in that case we may meet the correction phase amid profit-taking,” the analyst said.
Bitcoin price levels to watch
For now, patterns observed by the expert indicate that Bitcoin is consolidating above the $62,750 level, pointing to some short-term stability. However, should selling pressure push the price below this level, a sharp move toward lower liquidity zones could follow, potentially bringing Bitcoin down to $61,300 or even further to $59,400 and $57,730.
With Rlinda acknowledging that Bitcoin is currently in a consolidation phase, another crypto analyst with the pseudonym Trader Tardigrade observed in an X post on September 21 that the current formation is an anchor for notable gains.
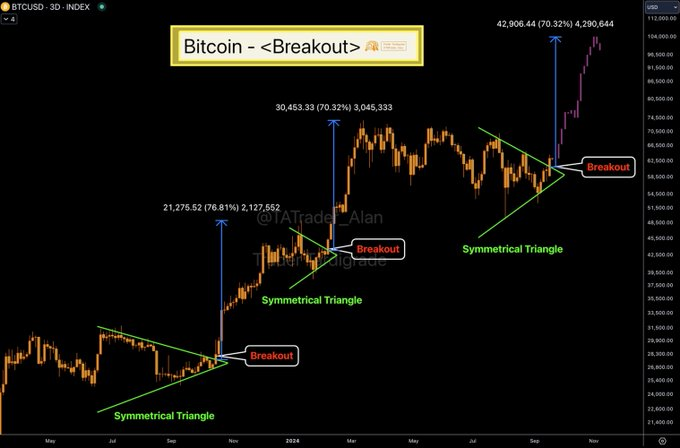
The analyst illustrated that the consolidation is happening within a symmetrical triangle pattern, and Bitcoin has surged through key resistance levels, signaling a major breakout. Historically, the pattern breakouts have preceded strong price movements, and this latest development is no exception.
Notably, the cryptocurrency’s price has already rallied significantly, achieving gains of over 70% from previous consolidation patterns. Now, the expert predicted that if history repeats, Bitcoin’s next target will be $100,000 based on the measured move of the technical pattern.
 Bitcoin price analysis chart. Source: Trader Tardigrade
Bitcoin price analysis
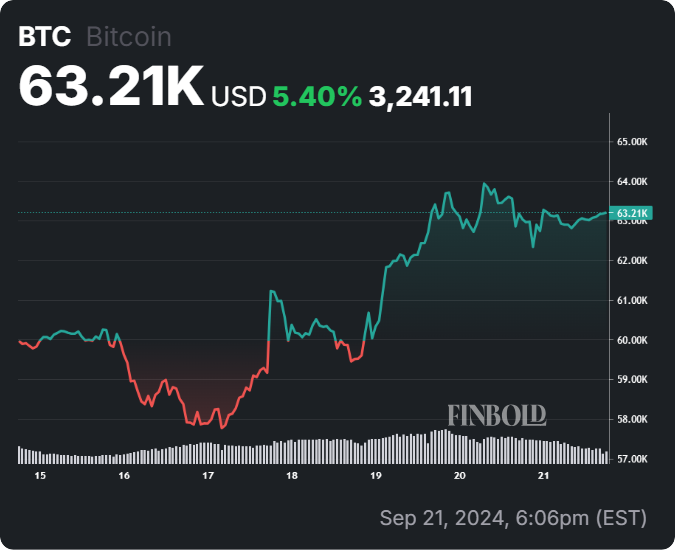
By press time, Bitcoin was trading at $63,214, with daily gains of less than 0.5%. On the weekly chart, the maiden cryptocurrency has rallied over 5%.
 Bitcoin seven-day price chart. Source: Finbold
Meanwhile, Bitcoin’s technical indicators are bullish, with a summary of the one-day gauges retrieved from TradingView aligning with the ‘buy’ sentiment at 14. On the other hand, moving averages are for a ‘strong buy’ at 12, while oscillators are ‘neutral’ at 6.
 Bitcoin one-day technical indicators. Source: TradingView
In summary, Bitcoin is presenting both opportunities and challenges at the moment, hence, investors should remain cautious as a failure to break through the highlighted resistances could trigger a price correction.
Disclaimer: The content on this site should not be considered investment advice. Investing is speculative. When investing, your capital is at risk.


