Cardano ‘flashing the strongest buy signal’ in a month, targets $5
Cardano ‘flashing the strongest buy signal’ in a month, targets $5 
![]() Cryptocurrency Sep 24, 2024 Share
Cryptocurrency Sep 24, 2024 Share
After months of consolidating below the $1 mark, an analyst has observed that Cardano (ADA) could be primed for a potential parabolic rally based on the token’s technical setup.
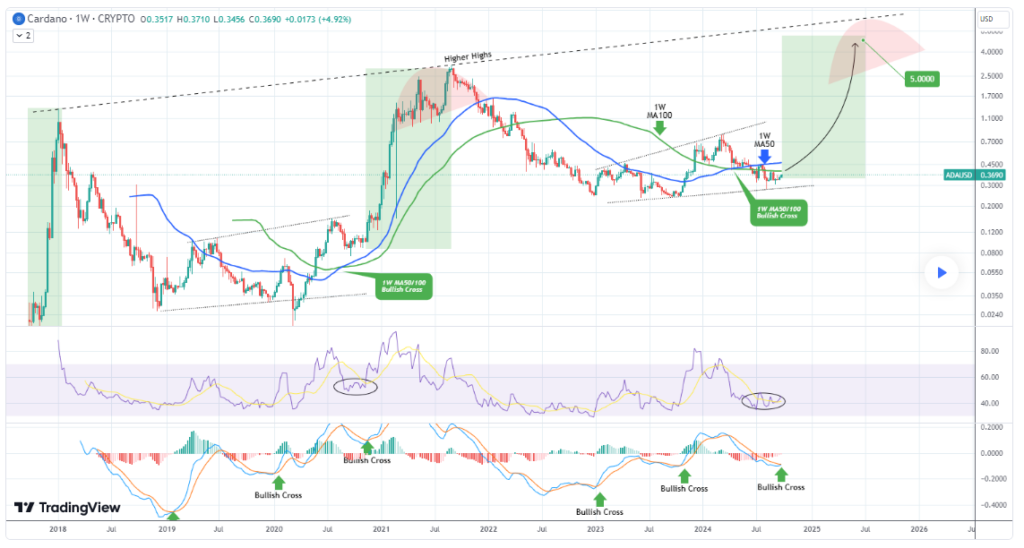
In this context, ADA has triggered one of the most powerful buy signals on its weekly time frame, targeting price levels around $5, as observed by TradingShot in a TradingView post on September 24.
According to the analysis, Cardano’s one-week Logarithmic Moving Average Convergence Divergence (1W LMACD) has formed a bullish cross for the first time since October 2023. This signal marks a significant shift for ADA, suggesting that a major upward move could be on the horizon.
Picks for you
Ripple sells over $200 million of XRP in September's selling spree 4 hours ago Underground crypto mining farms uncovered in Russia's Dagestan 5 hours ago Billionaires are dumping Nvidia stock to buy this Index Fund 6 hours ago Cryptocurrency trader turns $135 into $1.2 million in 15 days 7 hours ago  ADA price analysis chart. Source: TradingView/TradingShot
Notably, the bullish cross on the 1W LMACD is considered one of the strongest long-term buy signals. This is particularly important as it mirrors conditions seen during the previous bull cycle, which propelled Cardano to new highs.
Another possible positive outlook can be derived from the fact that the expert noted ADA has been consolidating below its 50-week moving average (1W MA50) since May. This consolidation phase is important because it precedes a breakout, like the pattern observed during previous rallies.
On the other hand, the DeFi token’s one-week Relative Strength Index (RSI) has been ranging, further indicating that the market has been in a period of accumulation. As the RSI has remained relatively neutral, it shows the potential for ADA to break into a new rally once buying momentum picks up.
The analysis also pointed to the bullish megaphone pattern forming alongside the 1W MA50 and MA100. According to the expert, this combination suggests that Cardano could be at the start of a parabolic rally that may take it to new highs, with the chart highlighting the $5.00 price as a possible target for this cycle.
“This time we have all these formations emerged again, so any week now, Cardano could start its new Parabolic Rally. With a Higher Highs trend-line setting a clear Resistance, we see a $5.00 price as a strong Target for the Cycle Top,” the expert noted.
ADA’s road to $1
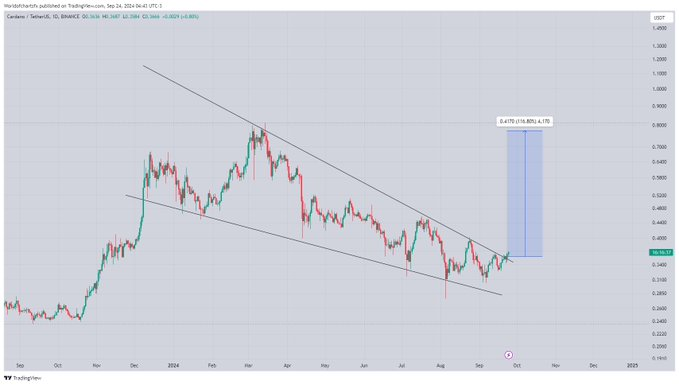
Meanwhile, ADA has been experiencing a notable bullish price trajectory in the short term, and this price movement has sparked additional predictions that the crypto is likely to continue this momentum. To this end, a crypto analyst with the pseudonym Post World Of Charts noted in an X post on September 24 that ADA is breaking out from a descending channel, a move that has been anticipated for some time.
In the analysis, Cardano has confirmed the breakout, breaking through key resistance levels. The next target appears to be $1, as the price has shown strong momentum and upward potential.
 ADA price analysis chart. Source: TradingView/TradingShot
Besides the technical outlook, ADA will also be banking on the ongoing network development on the Cardano network to spark possible growth. For instance, the platform continues to witness a surge in the number of smart contracts, which has increased to over 70,000 in 2024, as reported by Finbold on September 19.
At the same time, the network received a major boost after the completion of the first leg of its Chang hard fork. This development sets the stage for more decentralized governance, allowing the platform to compete with established entities such as Ethereum (ETH).
ADA price analysis
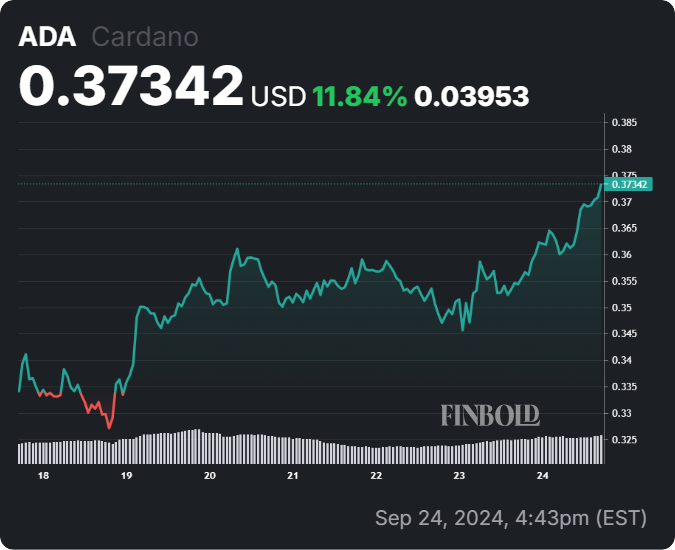
At press time, Cardano was trading at $0.37, gaining over 5% in the last 24 hours. On the weekly chart, the token is up almost 12%.
 ADA seven-day price chart. Source: Finbold
A review of the price movement indicates that Cardano is trading above its 50-day SMA of $0.348, pointing to a short-term bullish momentum. However, it remains below the 200-day SMA of $0.463, reflecting a long-term downtrend.
In summary, for the bullish momentum highlighted by experts to be confirmed, ADA needs to break above the 200-day SMA, which could signal a stronger rally. Staying below it may indicate continued consolidation or downward pressure.


