Analysts predicts Bitcoin’s current support level $97K; could it hit a new ATH soon?
Ali, a crypto analyst, points to Bitcoin’s potential support level at $97,530 as key in sustaining the current bullish momentum. The main support level to be monitored for Bitcoin is $97,530. Staying over this level is critical to keeping the current bullish momentum afloat, believes Ali.
Bitcoin (BTC) has been trading in a tight range since hitting a new all-time high (ATH) of $109K on Jan. 20, 2025, and is now quoted at $105,128.95 as of Jan. 24. This reflects a 3.5% decline from the previous high, as per CoinMarketCap.
Understanding Bitcoin’s support level
In crypto trading, support levels are an important price point, where buying demand usually increases. Should BTC remain above this significant threshold, it may continue its trajectory upward, with investors feeling confident in this bullish decision. This level is a key litmus test of BTC’s market strength during volatility.
You might also like: Ex-Paxful CEO’s Bitcoin marketplace Noones exploited for nearly $8m, ZachXBT says
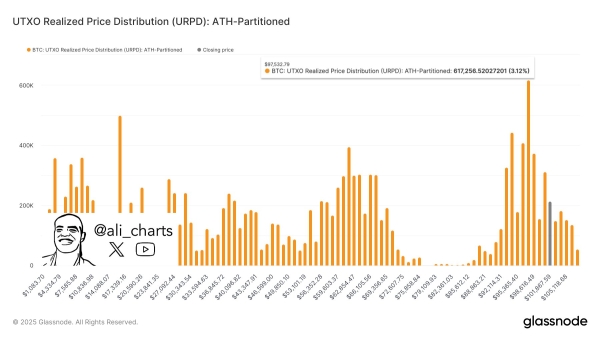
As posted by analyst Ali, the UTXO Realized Price Distribution (URPD) informs traders of where Bitcoin holders purchased their BTC or last moved their BTC. It indicates the number of BTC that have last moved to wallets priced at various price levels.
 Bitcoin UTXO Realized Price Distribution (URPD) chart, partitioned by ATH levels. This visualization highlights areas of strong on-chain activity, reflecting key accumulation and distribution zones. Data source: @ali_charts
At $97,530, the URPD chart shows a cluster of activity, which means many investors bought or are sitting on a holding of BTC around this level. Strong buying interest at this level reinforces its role as a psychological and technical support.
Bitcoin mimicking past ATH trend
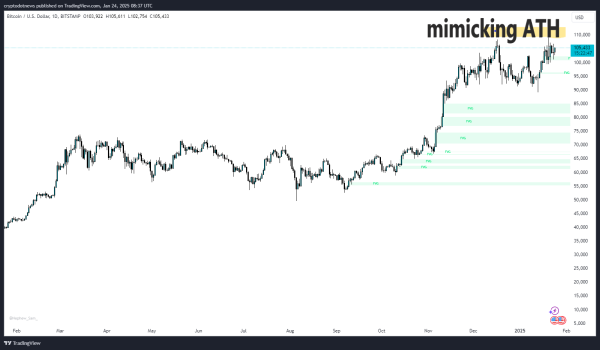
The behavior around $97,530 mimics that seen in previous ATH consolidation phases for BTC. As with prior cycles, the price is stabilizing near a supportive zone with the potential for an upside. This level showed strong buyer confidence, though there are some light pullbacks.
 Bitcoin price analysis on the daily chart. The price is approaching a resistance zone near $110,000, with several fair value gaps (FVG) identified as potential support levels. Current price: $105K. Sourced from TradingView by crypto.news
Analyzing sell-side risk of Bitcoin
The Sell-Side Risk Ratio, which measures the pressure from investors who are liquidating holdings, has declined as the amount of BTC sent to exchanges for sale has fallen. Such diminishing sell-side pressure is bolstering the current price stability of BTC. Glassnode also highlights shrinking volatility metrics, with BTC trading in an exceptionally narrow 60-day price range, which is often a precursor to significant market events.
 Bitcoin sell-side risk ratio chart, showcasing market behavior over time. The orange line highlights shifts in selling pressure, while the gray line traces BTC’s price trajectory. Red and blue thresholds indicate critical levels of market realization. Data source: Glassnode by crypto.news
Will Bitcoin sustain the bull run?
To reiterate crypto analyst Ali, the ongoing bull run will largely depend on whether BTC can maintain its key support level at $97,530. On-chain fundamental data confirms diminished sell-side pressure and consistent accumulation by long-term holders as indicators that the market is in a solid position to sustain upward movement.
Long-term #Bitcoin $BTC holders have experienced every phase of the market cycle, and right now, greed is taking over! pic.twitter.com/2RL6clWLOZ
— Ali (@ali_charts) January 24, 2025
If this level is maintained as support, then BTC could see a retest and a new market peak towards its former all-time high, boosting the ongoing bullish run. However, failing to hold $97,530 could introduce risks to the bull run.
Read more: Here’s why Bitcoin and most altcoins are falling
Disclosure: This article does not represent investment advice. The content and materials featured on this page are for educational purposes only.


