Bitcoin ($BTC) Price Prediction for June 2025: Can Bulls Defend $105K and Extend the Rally Toward New Highs?
The Bitcoin price is going to enter June 2025 on a strong long-term footing, but short-term signals point to cooling momentum after the latest rally to multi-month highs. With price action now facing resistance around the $112,000 mark, traders are assessing whether this is a temporary pause or a precursor to a broader pullback. This article evaluates the monthly forecast using multi-timeframe analysis, combining short-term indicators with the weekly macro structure.
What’s Happening With Bitcoin’s Price?
 BTCUSD price dynamics (Source: TradingView)
The Bitcoin price today is around $105,800, retreating slightly from recent highs near $112,000. While the long-term trend remains upward, short-term sellers have re-entered the market as price faces rejection at the upper bounds of a critical resistance zone.
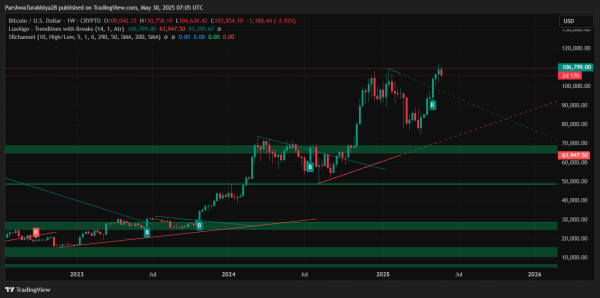
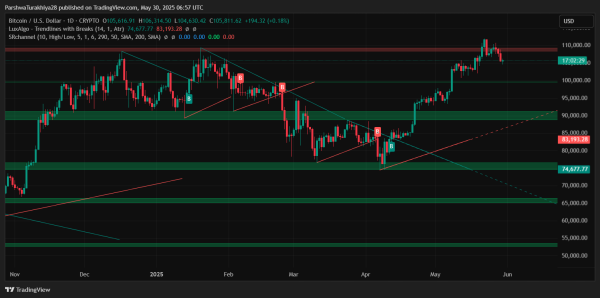
The weekly chart provides crucial context. Bitcoin broke decisively out of a descending wedge in early Q2 and has since reclaimed the $95,000 and $100,000 levels, flipping them into solid support. This macro breakout confirms the broader bullish structure, with price now moving in an upward channel. However, after a steep ascent through April and May, price is currently consolidating near the top of this range, suggesting limited upside without a cooling phase.
Breakdown Of Bitcoin’s Price Action
 BTCUSD price dynamics (Source: TradingView)
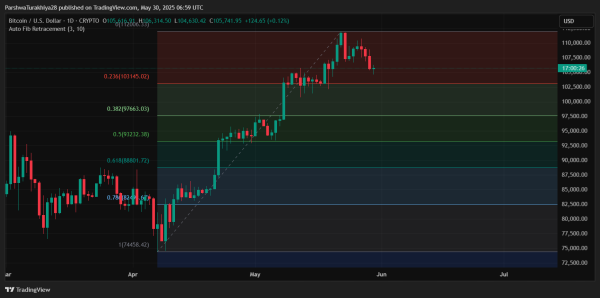
On the daily chart, Bitcoin has formed a lower high just beneath $112,000, and the price has retraced to the 0.236 Fibonacci level at $103,145. If this support holds, a continuation toward $115,000 remains possible. However, a breach below this level could expose the $97,663 and $93,200 zones (Fib 0.382 and 0.5 levels respectively) as downside targets.
 BTCUSD price dynamics (Source: TradingView)
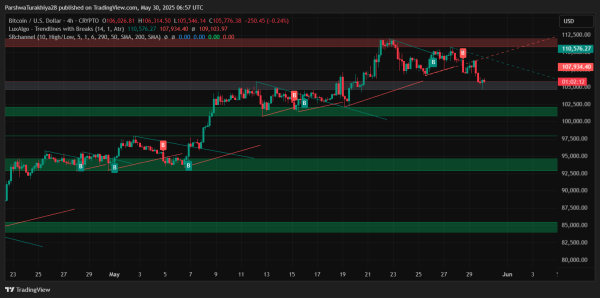
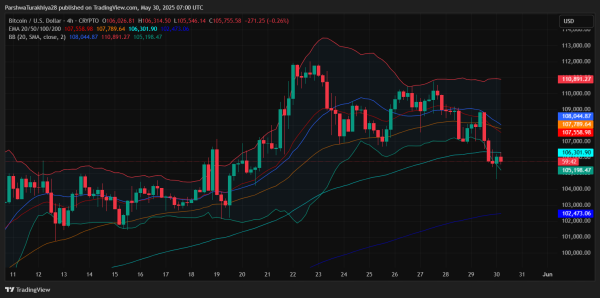
The 4-hour chart shows a clean breakdown from a rising wedge, with support now building around $105,000. The structure leans neutral to bearish in the short term, but no major bearish reversal has been confirmed yet. If bulls defend $105,000–$103,000, the next upward leg may commence toward previous highs.
Key Technical Indicators
 BTCUSD price dynamics (Source: TradingView)
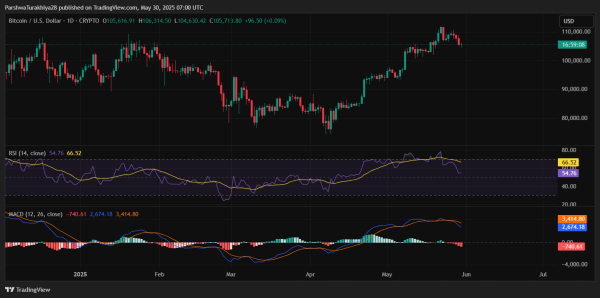
The Relative Strength Index (RSI) presents a mixed picture across timeframes. On the daily chart, RSI has cooled into the 55–60 zone after previously reaching overbought levels, indicating a slowdown in bullish momentum. However, the weekly RSI remains elevated, supporting the broader continuation of the uptrend as long as pullbacks remain contained.
Momentum analysis through the MACD also shows divergence across timeframes. On the daily chart, the MACD line has now crossed below the signal line, a development that typically signals weakening bullish momentum. In contrast, the weekly MACD still trends upward, suggesting that while short-term momentum may be fading, the longer-term structure remains constructive.
 BTCUSD price dynamics (Source: TradingView)
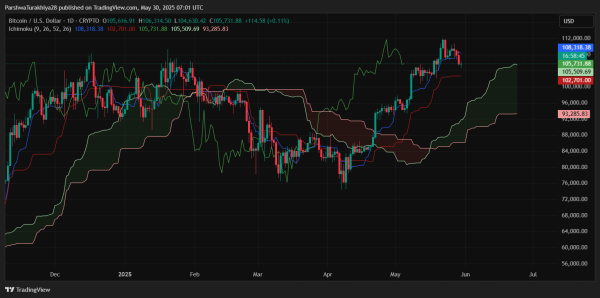
The Ichimoku Cloud offers further insight into trend conditions. On the daily timeframe, price action remains above the cloud, although the Chikou Span has begun to flatten, which could indicate slowing bullish strength. On the weekly chart, however, all major components of the cloud system remain bullishly aligned, reinforcing the prevailing long-term uptrend.
 BTCUSD price dynamics (Source: TradingView)
Meanwhile, the Bollinger Bands on both the 4-hour and daily charts are expanding again, signaling a fresh wave of volatility. The price is currently nearing the lower band on the 4-hour chart, which may act as short-term support and provide a possible bounce zone, even as broader market uncertainty persists.
Why is the Bitcoin Price Going Down Today?
 BTCUSD price dynamics (Source: TradingView)
The Bitcoin price volatility has increased as June begins, partly due to technical overextension. The strong rally from sub-$90,000 levels to $112,000 within weeks has triggered profit-taking. Additionally, macroeconomic headwinds—such as concerns over interest rate policy and mixed U.S. labor data—are weighing on sentiment.
So, why is the Bitcoin price going down today? Technically, it’s a natural correction after a parabolic move. The rejection near all-time highs and a wedge breakdown have opened the door for a controlled retracement toward high-demand zones. There’s no confirmation yet of trend reversal, but intraday momentum has clearly shifted.
Forecast Outlook For June 2025
Looking ahead, Bitcoin price action will likely revolve around three key levels: $103,000, $100,000, and $112,000.
If bulls successfully defend $103,000 and reestablish momentum, the price could test $112,000 again and aim for new highs near $115,000–$118,000. If $103,000 breaks, a deeper correction toward $97,000 or even $93,000 could unfold, allowing the market to reset before the next leg higher.
Given the strength of the weekly breakout and support from trendline structures, the broader bullish scenario remains intact. However, choppy conditions are expected through early-to-mid June as the market absorbs recent gains.
Bitcoin Price Forecast Table (June 2025 Outlook)
| Timeframe | Market Bias | Key Resistance | Key Support | Technical Notes |
| Weekly | Strong Bullish | $112,000 – $115,000 | $100,000 – $97,000 | Weekly breakout intact, trendline holding |
| Daily | Cautious Bullish | $110,500 – $112,000 | $103,145 – $100,000 | MACD weakening, RSI neutral |
| 4H | Bearish | $108,000 – $110,000 | $105,000 – $103,000 | Wedge breakdown, short-term momentum bearish |
| Monthly (Outlook) | Gradual Bullish | $115,000 – $118,000 | $97,000 – $93,000 | Fib retracement zones, EMA trend still bullish |
The Bitcoin price update for June 2025 suggests a period of consolidation or shallow correction after a strong rally in April and May. While lower timeframe charts show signs of fatigue, the broader structure remains bullish. As long as the $100,000 level holds, dips are likely to be viewed as buying opportunities.
June is likely to see Bitcoin oscillate between $103,000 and $112,000, with breakout potential in either direction depending on macro catalysts and volume confirmation. Traders should closely monitor how price behaves near $103,000 and whether bulls can reclaim $108,000 in the first half of the month.
Disclaimer: The information presented in this article is for informational and educational purposes only. The article does not constitute financial advice or advice of any kind. Coin Edition is not responsible for any losses incurred as a result of the utilization of content, products, or services mentioned. Readers are advised to exercise caution before taking any action related to the company.