Bitcoin (BTC) Price Prediction for June 23, 2025: BTC Holds Above $101K as Options Expiry Nears and Bears Pressure $105K Zone
The Bitcoin price today is trading near $101,200 after a volatile weekend session that saw buyers defend a critical liquidity pocket just above $100,000. With the June 27 options expiry approaching, price action reflects tightening conditions as bulls and bears clash near key technical zones.
While the broader structure remains rangebound on higher timeframes, lower timeframes reveal weakening bullish momentum and signs of increasing volatility.
What’s Happening With Bitcoin’s Price?
 BTC price forecast (Source: TradingView)
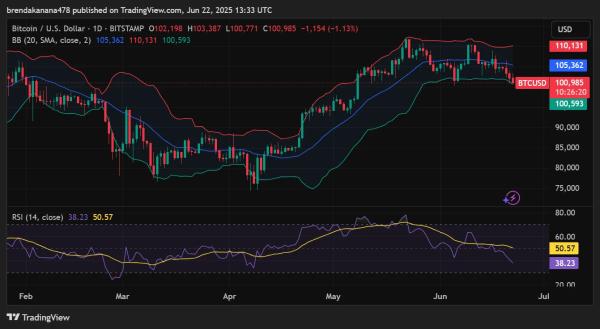
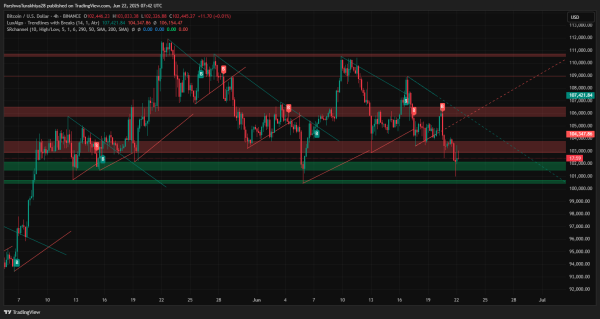
As of June 23, 2025, the Bitcoin price remains under pressure following a rejection from the $105,200 zone, which aligns with both trendline resistance and a prior order block. Price has been consolidating just above $101,000 after sweeping a key support cluster on June 21, with sellers remaining active below $103,000.
 BTC price forecast (Source: TradingView)
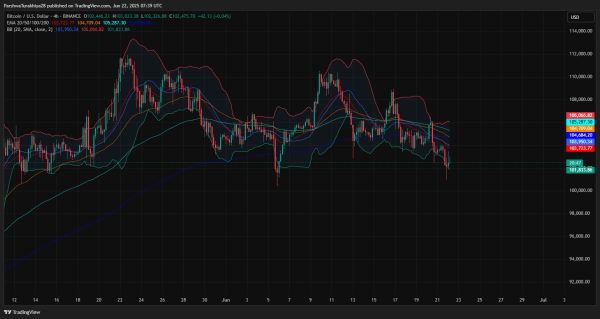
The recent rejection marks the third failed attempt to break above $106,000 this month. On the 12-hour and daily charts, BTC structure remains neutral-to-bearish, with price trading below all major EMAs (20/50/100/200). This alignment is now forming a bearish cluster that suggests sellers continue to control the short-term trend.
The current Bitcoin price action also coincides with heavy sell-side liquidity seen around $105,000–$106,000. If price fails to reclaim this zone ahead of the June 27 options expiry, further downside pressure toward the $98,000–$100,000 support base cannot be ruled out.
Bitcoin Price Action Faces Rejection at Key Resistance
 BTC price forecast (Source: TradingView)
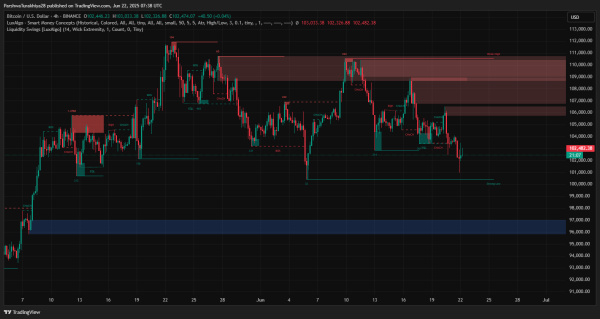
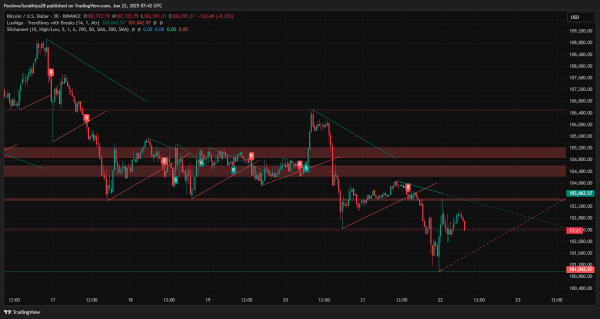
The 4-hour chart reveals a clear downtrend from the mid-June peak. Bitcoin has consistently printed lower highs, with price now trapped beneath a declining trendline that has been tested multiple times without confirmation of a breakout.
A series of order blocks between $104,200 and $106,400 have acted as strong overhead resistance. The most recent attempt to break through this zone failed, with a sharp wick rejection back toward $101,000.
Additionally, the Bollinger Bands on this timeframe show narrowing volatility followed by expansion, a common precursor to strong directional moves. The price rejection at the upper band on June 21 suggests that sellers are actively defending rallies.
Momentum Indicators Signal Bearish Pressure Ahead
 BTC price forecast (Source: TradingView)
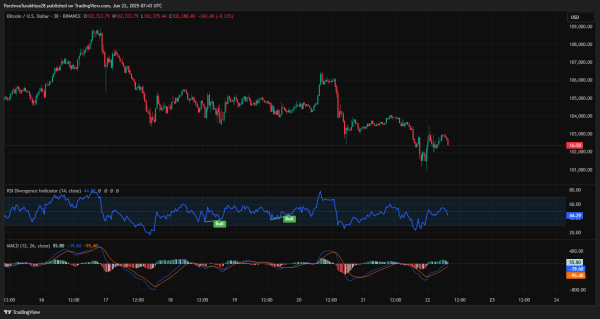
On the 2-hour and 30-minute charts, momentum indicators continue to favor the bears. The RSI has broken below 40 and remains in a weak zone, while the MACD histogram on both timeframes has flipped red, signaling a loss in bullish strength. A hidden bearish divergence on the RSI can be observed when comparing recent swing highs near $104,000 to prior peaks.
 BTC price forecast (Source: TradingView)
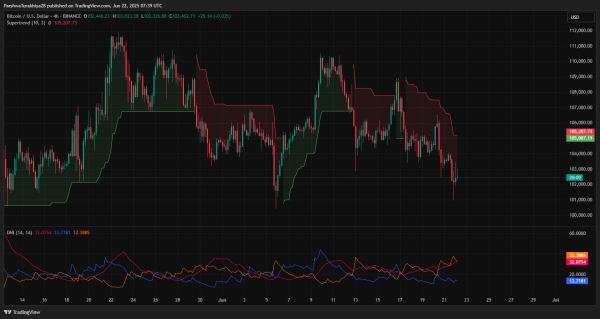
The 4-hour Supertrend remains in bearish mode, with resistance now anchored at $105,207. The DMI indicator on the 4-hour chart highlights dominant -DI strength at 33.18 versus +DI at 15.21, with the ADX climbing toward 25, suggesting an increase in directional bearish momentum.
These signals align with short-term trader concerns around the upcoming options expiry, which is now influencing intraday positioning and volatility expectations.
Exchange Flows and Options Data Confirm Bearish Bias
 BTC net inflows/outflows (Source: Coinglass)
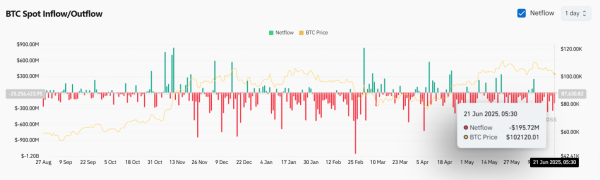
On-chain exchange data shows that on June 21, over $195.72 million in Bitcoin price net outflows were recorded, with BTC priced around $101,200 at the time. This negative netflow reflects risk-off sentiment as traders likely reposition ahead of volatility expected around the June 27 options expiry.
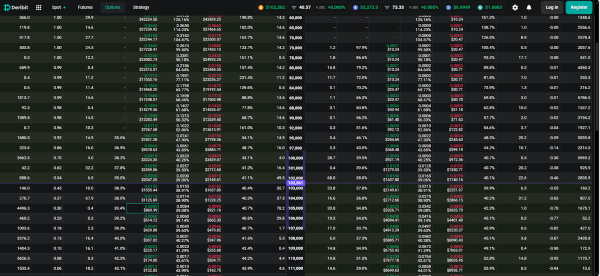 BTC option chain data (Source: Deribit)
From a derivative perspective, open interest remains heavily skewed toward puts at the $100,000 strike, indicating strong market anticipation of further downside unless BTC can quickly reclaim the $105,000 zone. This adds pressure to bulls to stage a meaningful bounce early in the week.
Why Bitcoin Price Going Down Today?
 BTC price forecast (Source: TradingView)
The Bitcoin price today is down due to several compounding factors. First, technical resistance between $104,200 and $106,000 remains firm. Second, key momentum indicators like RSI and MACD have turned bearish across multiple timeframes. Third, the June 27 options expiry introduces near-term volatility and encourages risk-averse positioning.
Finally, bearish dominance on the DMI indicator and negative spot exchange flows add weight to a potential short-term pullback.
Until BTC can flip $105,200 into support, any relief bounce is likely to be met with renewed selling pressure.
Short-Term Outlook and Technical Forecast
BTC needs to decisively break above $105,200 and close above the trendline resistance to invalidate the bearish setup. Failure to do so keeps the downside targets at $100,000 and $98,400 in play. A breakdown below $98,000 may open the door to a retest of the $95,700–$96,300 demand zone. Upside targets remain at $106,400 and $108,000 if a breakout occurs.
| Indicator/Zone | Level (USD) | Signal |
| Resistance 1 | 105,200 | Trendline + Supertrend barrier |
| Resistance 2 | 106,400 | Rejection zone/order block |
| Support 1 | 100,800 | Short-term demand |
| Support 2 | 98,400 | Breakdown risk level |
| EMA 20/50/100/200 (4H) | Bearish Cluster Below Price | Weak structure |
| RSI (2H/4H) | Below 40 | Weak momentum |
| MACD Histogram (2H/4H) | Negative | Bearish crossover |
| Bollinger Bands (4H) | Expanding | Volatility increasing |
| DMI -DI > +DI | -DI: 33.18 / +DI: 15.21 | Bearish pressure dominates |
| Options Expiry Pressure | June 27 | Heightened downside risk |
Disclaimer: The information presented in this article is for informational and educational purposes only. The article does not constitute financial advice or advice of any kind. Coin Edition is not responsible for any losses incurred as a result of the utilization of content, products, or services mentioned. Readers are advised to exercise caution before taking any action related to the company.