Bitcoin Loses Important Support And Falls To A Low Of 90,000 Dollars
Cryptocurrency analysts of Coinidol.com report, Bitcoin (BTC) price has slipped below the 50-day SMA after a rejection of the recent high.
Bitcoin price long term forecast: bearish
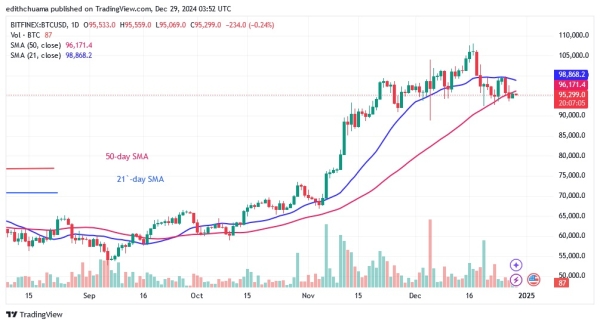
Buyers tried to hold the price above the 21-day SMA resistance but failed to do so on December 26. A break above the 21-day SMA barrier would have pushed Bitcoin to its previous high of $108,364. However, the bearish momentum broke through the 50-day SMA and Bitcoin fell to a low of $95,404. The bears are in control and are selling on rallies as Bitcoin falls into the bearish trend zone. The bulls are once again trying to keep the price above the 50-day SMA. If the 50-day SMA repels Bitcoin, it will fall further. Bitcoin price will fall and return to previous lows above $90,000. In the meantime, Bitcoin will remain below the barrier of the 50-day SMA.
Bitcoin indicator display
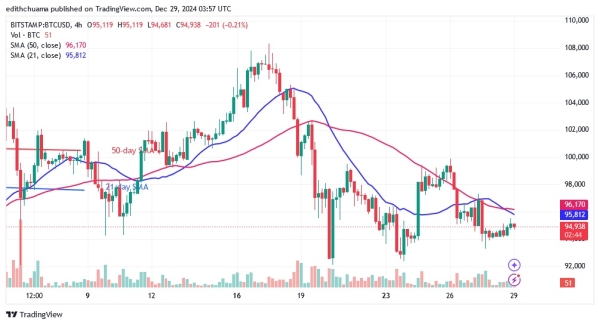
The largest cryptocurrency has slipped below its moving average lines. The cryptocurrency is likely to fall further. Both charts show price bars below the moving average lines. Currently, the price trend has paused above $94,000 as doji candlesticks appear.

Technical indicators:
Key resistance levels – $90,000 and $110,000
Key support levels – $70,000 and $50,000
Which cryptocurrency range for BTC/USD?
On the 4-hour chart, Bitcoin has risen above the $94,000 support as it resumes consolidation above the current support but below the moving average lines. If the current support is broken, Bitcoin will fall to its low of $90,000. On the daily chart, Bitcoin will resume its uptrend if buyers keep the price above the 21-day SMA.

Disclaimer. This analysis and forecast are the personal opinions of the author. They are not a recommendation to buy or sell cryptocurrency and should not be viewed as an endorsement by CoinIdol.com. Readers should do their research before investing in funds.


