Bitcoin price is set for expressive growth, according to key indicators
Bitcoin price is set for expressive growth, according to key indicators 
![]() Cryptocurrency Jul 26, 2024 Share
Cryptocurrency Jul 26, 2024 Share
Bitcoin (BTC) is on a volatile ride inside a five-month price range between $60,000 and $72,000. Yet, two key fundamental analysis indicators suggest the momentum is now stronger, and BTC could be ready for expressive growth.
In particular, Finbold analyzed the Market Value to Realized Value (MVRV) and Network Value-to-Transaction (NVT) onchain indicators on Santiment‘s platform. On July 26, these metrics hint at a favorable scenario for Bitcoin to retest and possibly break the range’s resistance.
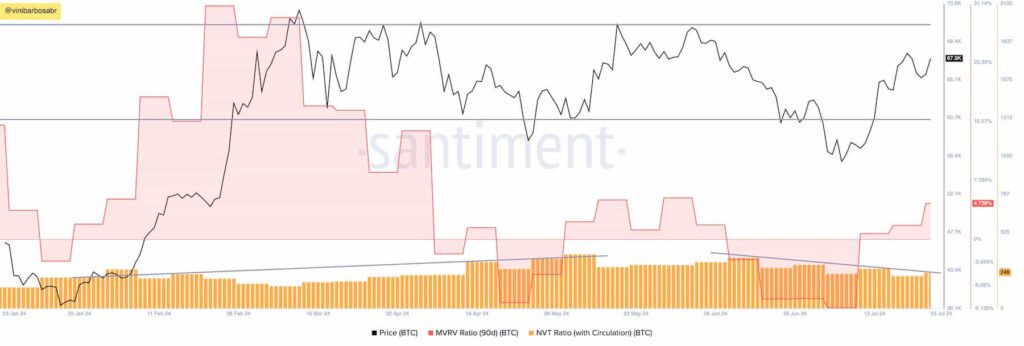
As of this writing, Bitcoin trades at $67,500 with a recovering 90-day MVRV ratio of 4.74% and a circulation-based NVT in a downtrend at 248 points. The potential breakout, however, may not occur immediately, and BTC could retest the range’s support before bouncing back up.
Picks for you
Buy signal for two strong cryptocurrencies this week 30 mins ago Bitcoin, gold, or stocks? Senior commodity strategist weighs in on the battle 48 mins ago Bitcoin targeting $90,000 after confirming this key bullish crossover 3 hours ago BlackRock reveals the only 2 cryptocurrencies worth buying 4 hours ago  BTC: MVRV Ratio (90d) + NVT Ratio (with Circulation). Source: Santiment / Finbold (@vinibarbosabr)
What do MVRV and NVT indicators mean for Bitcoin’s price growth?
First, the Market Value to Realized Value measures the mean expected profit all Bitcoin addresses would have if selling now.
At the current ratio and within this specific time frame, the mean of BTC purchases in the last 90 days would profit less than 5%. This is considered a low and, thus, unlikely to create any meaningful selling pressure.
Notably, Bitcoin’s all-time high at $73,800 saw a surging 90-day MVRV for a peak at above 30%. On the other hand, the recent downward deviation from the five-month range saw a negative MVRV of minus 9%. The latter event marked a local bottom, while the former was a local top.
Meanwhile, historical data on the chart shows an uptrend in the Network Value-to-Transaction indicator as the price ranged before crashing. However, the key network value indicator has been down-trending since early June, suggesting a bullish market shift for Bitcoin’s price.
Essentially, the NVT measures how undervalued or overvalued the network is, dividing the cryptocurrency market cap for the blockchain transactions. Finbold previously reported an overvalued NVT for Bitcoin, which has now changed.
BTC traders and investors should follow these and other metrics in order to better understand the factors that could influence the cryptocurrency’s price action. Nevertheless, cryptocurrencies can be very volatile and unpredictable assets, requiring caution amid speculation.
Disclaimer: The content on this site should not be considered investment advice. Investing is speculative. When investing, your capital is at risk.


