Bitcoin Price Watch: Bulls Fight Back as Bitcoin Eyes $90K Breakout
As of 4:35 p.m. ET on March 4, 2025, bitcoin commanded a valuation of $88,165, boasting a market capitalization of $1.72 trillion and a 24-hour trading volume of $69.81 billion. The digital asset oscillated between an intraday trough of $81,463 and a peak of $88,825, reflecting a market teetering between hesitation and ambition.
Bitcoin
Bitcoin‘s 1-hour chart reveals a tentative rebound emerging from the $81,463 foothold, as buyers nudge the price toward the $88,000–$89,500 resistance corridor. While the $84,000–$85,000 support band has demonstrated tenacious demand, a breach below this threshold could invite renewed downward momentum. Though the momentum oscillator flashes a bullish signal, the moving average convergence divergence (MACD) lingers in bearish territory, casting doubt on the rally’s longevity.
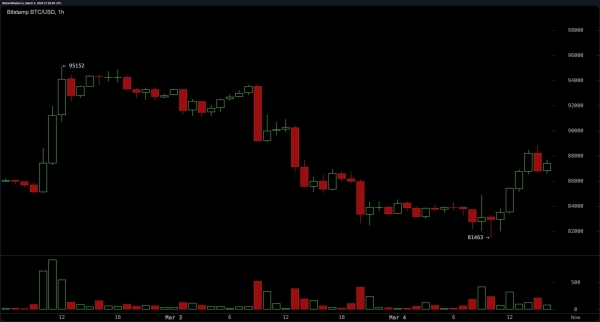 BTC/USD 1H chart via Bitstamp on March 4, 2025.
On the 4-hour chart, bitcoin’s pronounced descent persists despite flickers of resilience. A rebound from the $78,000 low has stabilized prices above $85,000—a potential pivot for upward traction. The $90,000–$92,000 barrier looms as a critical litmus test, with prior rejections hinting at latent seller dominance. The average directional index (ADX), positioned at 40, implies tempered trend vigor, while the commodity channel index (CCI) at -93 hovers neutrally, offering little directional clarity.
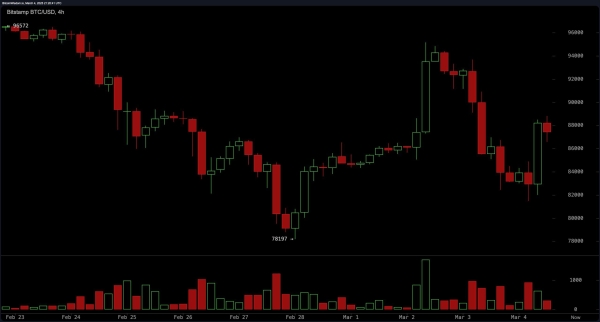 BTC/USD 4H chart via Bitstamp on March 4, 2025.
Zooming out, the bitcoin‘s daily chart paints a bearish backdrop following bitcoin’s retreat from the all-time high at $109,356 to $78,197. Short-term moving averages (MAs)—the exponential moving average (EMA) 10 at $89,051, EMA 20 at $91,471, and EMA 50 at $94,594—all advocate caution. Yet the EMA 200 ($85,734) and simple moving average (SMA) 200 ($82,589) whisper encouragement to patient accumulators, framing the current range as a potential long-term entry window.
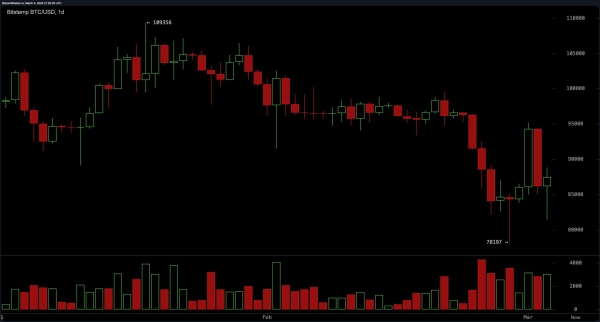 BTC/USD 1D chart via Bitstamp on March 4, 2025.
Oscillators echo market ambivalence: the relative strength index (RSI) at 42 and the awesome oscillator at -8,591 both idle neutrally, while the Stochastic at 52 refrains from signaling extremes. This cacophony of indecision demands prudence; traders ought to await confirmation before staking claims.
Bitcoin’s immediate fate pivots on its ability to anchor above $85,000. A decisive vault past $90,000 could ignite a challenge of the $95,000–$100,000 fortress. Conversely, crumbling support may resurrect bears, dragging prices toward $81,000 or below. Amid this tug-of-war between timeframes, astute participants will track volume shifts and pivotal price thresholds—a chess match where patience precedes profit.
Bull Verdict:
Bitcoin’s recent bounce from the $81,463 low and strong buying interest above $85,000 suggest a potential shift in momentum. If the price holds above this key level and breaks through resistance at $90,000 to $92,000, a move toward $95,000 or higher becomes likely. Long-term support from the exponential moving average (200) and simple moving average (200) further supports a bullish case, indicating that the worst of the downtrend may be over.
Bear Verdict:
Despite the recent recovery, bitcoin remains in a broader downtrend, with key moving averages signaling continued selling pressure. The inability to break above resistance at $90,000 could result in another leg down, potentially retesting support near $81,000 or lower. With the moving average convergence divergence (MACD) level (12, 26) in sell territory and most moving averages aligned bearishly, the risk of further downside remains significant.