Bitcoin Rainbow Chart predicts BTC price for June 30, 2025
Bitcoin Rainbow Chart predicts BTC price for June 30, 2025 
![]() Cryptocurrency Jun 4, 2025 Share
Cryptocurrency Jun 4, 2025 Share
As Bitcoin (BTC) hovers around the $105,000 mark, the Rainbow Chart suggests the asset will likely stay above six figures by the end of June.
This chart uses a logarithmic regression curve based on Bitcoin’s historical price data. It’s color-coded to reflect market sentiment, divided into nine distinct bands, ranging from deep undervaluation to extreme overvaluation.
For June 30, 2025, the Rainbow Chart projects a potential Bitcoin price range from $33,670 to $381,342, depending on market dynamics.
 Bitcoin Rainbow chart. Source: BlockhainCenter
At the lower end, the “Basically a Fire Sale” zone spans $33,669.71 to $44,134.48, signaling a rare bargain. Just above it, the “BUY!” band ranges from $44,134.48 to $59,711.44, followed by “Accumulate,” from $59,711.44 to $77,365.08.
Further up, the “Still Cheap” zone runs from $77,365.08 to $100,268.08, leading into the current range, “HODL!”, which spans $100,268.08 to $131,761.75.
Beyond this point, sentiment shifts into more speculative territory. The “Is this a bubble?” band covers $131,761.75 to $168,381.26, hinting at potential market froth. That’s followed by “FOMO Intensifies,” from $168,381.26 to $216,493.85, where investor enthusiasm tends to spike.
Higher still, the chart enters warning territory. “Sell. Seriously, SELL!” covers $216,493.85 to $282,752.48, typically associated with overheated markets. At the top lies “Maximum Bubble Territory,” ranging from $282,752.48 to $381,341.76—suggesting extreme overvaluation.
Bitcoin price analysis
Meanwhile, Bitcoin was trading at $105,478 at press time, down over 1% in the last 24 hours.
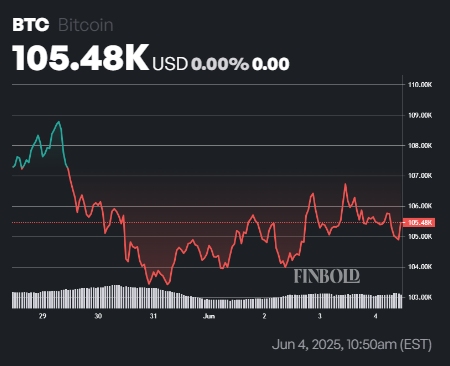 Bitcoin seven-day price chart. Source: Finbold
Given this price, Bitcoin currently falls within the “HODL!” band, indicating it’s neither deeply undervalued nor in bubble territory. Bitcoin is likely to trade in this band at the end of June if the market momentum remains the same.
At the same time, sentiment remains bullish overall. Bitcoin is trading above its 50-day simple moving average (SMA) of $99,700 and 200-day SMA of $87,070, which signals a strong upward trend.
Meanwhile, the 14-day Relative Strength Index (RSI) is 54.22, pointing to neutral-to-slightly bullish momentum without overbought conditions.
Featured image via Shutterstock