Bitcoin’s next 3 price levels to watch after record high
Bitcoin’s next 3 price levels to watch after record high 
![]() Cryptocurrency Jul 14, 2025 Share
Cryptocurrency Jul 14, 2025 Share
After hitting a new all-time high above $123,000, a cryptocurrency trading analyst has identified three key price levels that could help Bitcoin sustain its upward momentum.
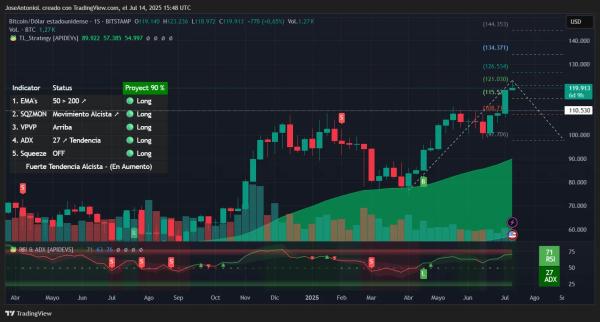
According to Ali Martinez, the current bull run was fueled by Bitcoin breaking out of a months-long parallel trading channel, a move that sets the stage for further gains, he said in an X post on July 14.
 Bitcoin price analysis chart. Source: TradingView
Martinez explained that the breakout represents a major shift in market structure.
Specifically, Bitcoin’s surge past the crucial resistance zone near $113,000 confirmed the ongoing bullish trend that’s been forming since April.
After spending weeks consolidating below that level, the breakout has now flipped former resistance into support, clearing the path for another leg higher.
Martinez pointed out that the $123,000 peak was the first major upside target following the breakout.
Bitcoin price levels to watch
Now that it’s been achieved, attention turns to the next key resistance levels at $131,000, $144,000, and $158,000, all of which align with long-term technical projections and psychological market barriers.
Meanwhile, fellow analyst Ted Pillows shared a similar outlook in a separate X post on July 14. According to Pillows, Bitcoin’s next target is likely $125,000, a level that could be reached within days.
He noted that Bitcoin appears to be moving through a classic Wyckoff accumulation pattern, with $125,000 marking a critical resistance before any possible consolidation phase.
$BTC made another ATH today.
The next major target is $125,000.
Looking at the market momentum, it seems like $125K BTC could happen in a few days. pic.twitter.com/2OmFGWyTbt
— Ted (@TedPillows) July 14, 2025
Bitcoin price analysis
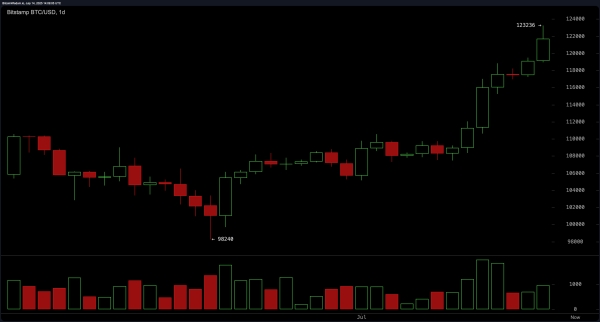
At press time, Bitcoin was trading at $121,797, up more than 3% in the past 24 hours.
 Bitcoin one-week price chart. Source: Finbold
From a technical standpoint, Bitcoin’s 50-day simple moving average (SMA) currently sits at $107,362, signaling a strong short-term trend as the price remains well above it. The 200-day SMA stands at $88,660, reinforcing a bullish long-term outlook.
However, the 14-day Relative Strength Index (RSI) is at 74.77, indicating that Bitcoin is in overbought territory, which may suggest a near-term correction or period of consolidation.
Featured image via Shutterstock