Dogecoin (DOGE) price enters parabolic phase, targets $2
Dogecoin (DOGE) price enters parabolic phase, targets $2 
![]() Cryptocurrency Sep 20, 2024 Share
Cryptocurrency Sep 20, 2024 Share
Meme cryptocurrency Dogecoin’s (DOGE) price movement is signaling a potential breakout with a new all-time high in sight.
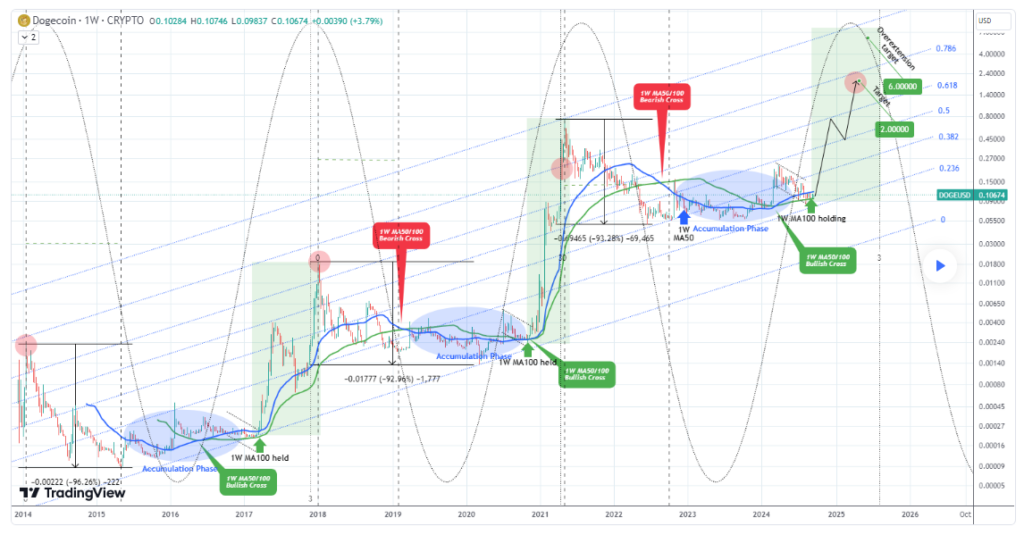
An analysis of recent chart patterns indicates that Dogecoin has officially begun its parabolic phase, following a cyclical trend consistent throughout its history, crypto analyst Trading Shot noted in a TradingView post on September 20.
The expert observed that Dogecoin had completed an extended accumulation phase, marked by a long period of price consolidation. This phase is a recurring pattern in Dogecoin’s market cycles and typically sets the stage for bullish movement.
Picks for you
Bitcoin analyst eyes $40,000: 'Prepare for the crash' 2 hours ago Is the United States already in a recession? 3 hours ago XRP whales make huge splash as price nears $0.60 4 hours ago Bybit improves security with AI Risk Engine 7 hours ago
According to Trading Shot, the accumulation zone followed a 50-week moving average where the price held above the 100-week moving average, a crucial support line. This price action mirrors what occurred during Dogecoin’s previous cycles, leading to a breakout from a “bull flag” pattern and entering what is now the “Parabolic Rally” phase.
 DOGE price analysis chart. Source: TradingView/Trading Shot
Next DOGE price target
With the parabolic phase in motion, the analyst noted that the next target is $2 as the primary mark in this cycle. Historically, Dogecoin’s previous cycle tops in January 2014 and January 2018 were priced just below the 0.786 Fibonacci channel level. The following cycle top in April 2021 saw an overextension to the 1.0 Fibonacci level, driven by a wave of mainstream adoption and aggressive buying pressure.
While a similar overextension to $6 is possible in this cycle, it would likely require significant market momentum or new use cases for Dogecoin to drive substantial capital inflows. Without such factors, Trading Shot’s analysis sets the realistic price target at $2, which corresponds to just below the 0.786 Fibonacci level—a pattern consistent with the first two major cycle tops.
Timing-wise, Dogecoin appears to follow a well-defined cycle pattern, with each peak arriving just after the 3.0 Fibonacci time extension from the previous bear cycle bottom. In the past, this timing was accurate for both the January 2018 and April 2021 cycle tops.
Assuming the bottom of the last bear cycle occurred in early October 2022, shortly before the FTX crash, the next peak is expected around August 2025. This gives Dogecoin approximately 18 months to reach its next cycle top.
DOGE short-term outlook
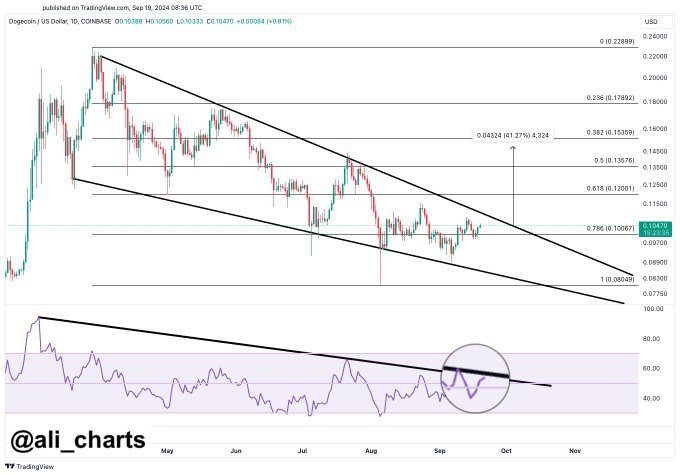
Another crypto trading expert, Ali Martinez, suggested in an X post on September 19 that Dogecoin is also bracing for a possible breakout, citing key technical indicators.
The first critical indicator is the Relative Strength Index (RSI), which is nearing a breakout of its long-standing descending trendline on the daily chart. The RSI measures the speed and change of price movements and is often used by traders to spot reversals. A breakout of this descending trendline would signal a potential shift in momentum, indicating that DOGE could experience stronger upward pressure.
The second signal is a break past the $0.11 resistance level. Currently, Dogecoin is consolidating below this resistance. Should the price surge beyond the $0.11 threshold, it would mark a bullish breakout, with analysts predicting a potential run toward the $0.13 to$0.14 price range.
 DOGE price analysis chart. Source: TradingView/Ali_charts
Dogecoin price analysis
At present, Dogecoin is trading around $0.104, but these technical signals suggest that momentum could be building for a significant upward move. Based on the current price movement, DOGE is showing short-term weakness, having plunged almost 0.5% in the last 24 hours. In the weekly timeframe, the meme coin is down over 3%.
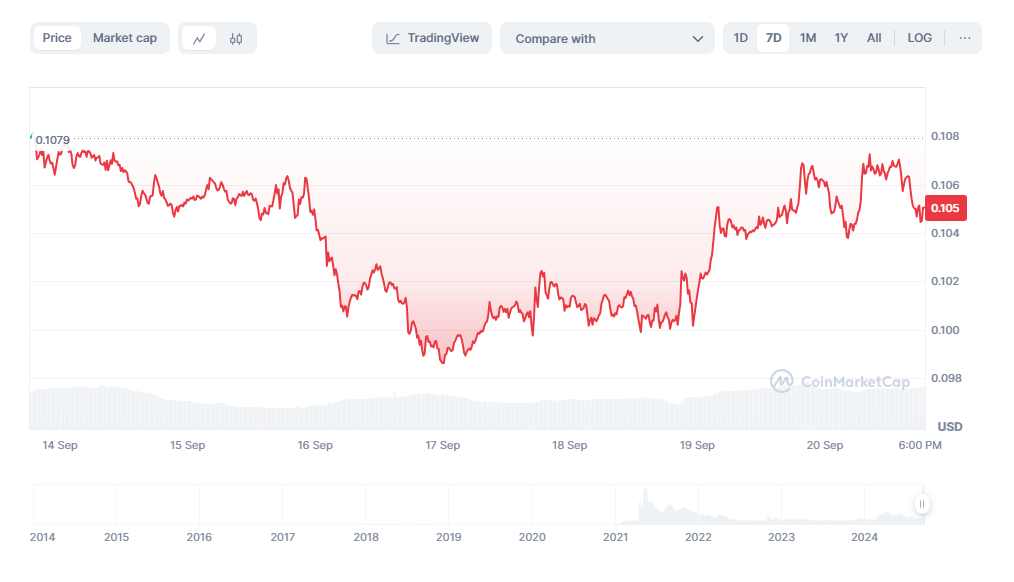 DOGE seven-day price chart. Source: CoinMarketCap
In summary, Dogecoin appears poised for potential bullish movement, supported by historical patterns and technical indicators. The outlook remains optimistic as it navigates key resistance levels, particularly if it breaks past the $0.11 threshold. However, attention should also be paid to the general market sentiment, as it will likely influence DOGE’s next price target.
Disclaimer: The content on this site should not be considered investment advice. Investing is speculative. When investing, your capital is at risk.

