Expert says Bitcoin to trade at $140,000 on this date
Expert says Bitcoin to trade at $140,000 on this date 
![]() Cryptocurrency Jul 11, 2025 Share
Cryptocurrency Jul 11, 2025 Share
Bitcoin (BTC) has skyrocketed past the $118,000 record high mark, and analysts are predicting the asset is likely to reach $140,000 soon.
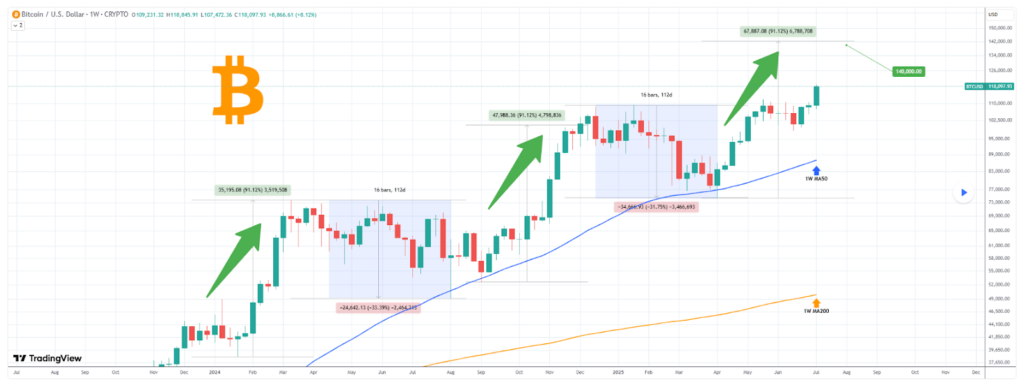
According to insights from TradingShot, this latest surge resembles previous upward trends recorded at the end of 2023.
In those earlier instances, Bitcoin underwent a sharp correction of approximately 32% over 112 days before rebounding strongly by around 91.12%. Notably, this upward momentum has typically been supported by the one-week 50-period moving average (MA), as pointed out in a TradingView post on July 11.
 Bitcoin price analysis chart. Source: TradingView
The current rally, which began on April 7, 2025, appears to be following a similar path. If things unfold as they did before, the analyst noted that the market could see Bitcoin climb to just above $140,000.
TradingShot also identified that a breakthrough from a bull flag pattern, formed between mid-May and June, has sparked this new surge. To this end, the outlook suggested that the maiden cryptocurrency might hit $140,000 as early as August 2025.
Bitcoin’s short-term target
Another analyst, Ted Pillows, shared a similar optimistic view. In an X post on July 10, he mentioned that Bitcoin could very well reach $120,000 in the short term.
He connected this growth to patterns known as Wyckoff Accumulation, noting that the increase in the global M2 money supply is a key factor driving this rally.
Pillows explained how Bitcoin’s movements align with the stages of Wyckoff’s model: it goes through an accumulation phase, then a spring, followed by a successful test, and finally a sign of strength that leads to the breakout.
$BTC hit a new ATH today.
But M2 supply growth is not slowing down.
$120K BTC is coming sooner than expected. pic.twitter.com/8glHcQUfWH
— Ted (@TedPillows) July 10, 2025
Bitcoin price analysis
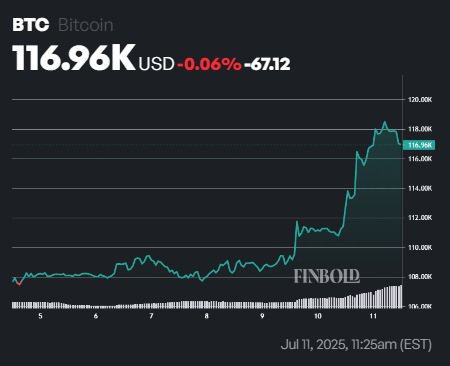
At press time, Bitcoin was trading at around $116,927, representing a nearly 5% rise in 24 hours and an 8% increase over the past week.
 Bitcoin seven-day price chart. Source: Finbold
The asset remains above its average prices over both the last 50 days ($106,816) and the last 200 days ($88,348), showing a long-term bullish trend. Additionally, Bitcoin’s Relative Strength Index (RSI) is at 70.77, indicating strong demand but also suggesting it’s approaching overbought territory.
Featured image via Shutterstock

