Here’s when XRP could reach $15, according to analyst
Here’s when XRP could reach $15, according to analyst 
![]() Cryptocurrency Feb 13, 2025 Share
Cryptocurrency Feb 13, 2025 Share
XRP spent most of 2024 trading sideways. However, it was one of the biggest beneficiaries of the bull run that kicked off in November. At first, 2025 seemed to be off to a good start for the token — however, momentum has shifted as of late.
Looking back, since the beginning of the year, XRP has seen prices increase by 17.91%. The current week-long stall in XRP price action seems set to continue. In the last 7 days, the cryptocurrency has shed 0.23% in value, while marking a 1.07% increase in price on the daily chart. At press time, XRP was changing hands for $2.45.
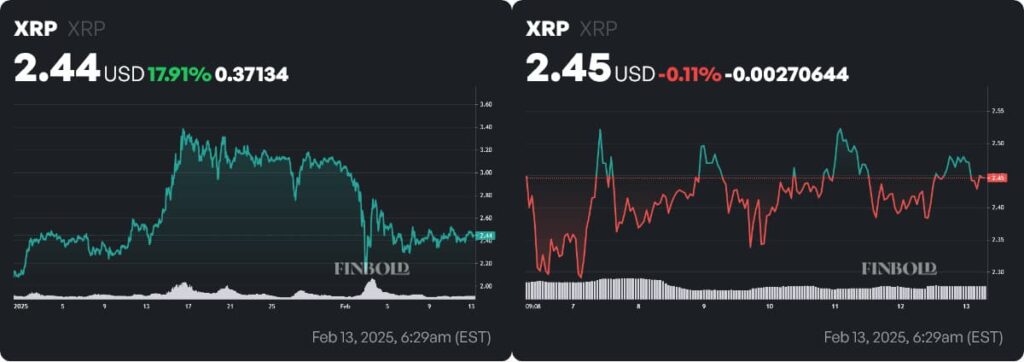 XRP price year-to-date (YTD) and 1-week charts. Source: Finbold
Despite these recent struggles, analysts are generally confident that the digital asset still has room to grow. Ripple Labs’ longstanding lawsuit with the Securities and Exchange Commission could be nearing a conclusion, as shakeups at the regulatory body will likely lead to a more favorable stance toward cryptocurrencies. One technical analyst recently outlined a case as to how XRP can make an upward move to $15.
Picks for you
Tether could need to dump part of its $8 billion Bitcoin holdings – What’s next for BTC and USDT? 2 hours ago R. Kiyosaki warns to ‘prepare for a market crash, depression, and war' 2 hours ago Spiko brings its T-Bills Money Market Funds to Etherlink 5 hours ago Jerome Powell on crypto: 'Many of these activities can be done inside of banks' 18 hours ago
Technical analyst predicts 512% surge in XRP price
On February 13, noted cryptocurrency researcher Ali Martinez highlighted a possible symmetrical triangle chart pattern in a post on social media platform X.
The pattern in question, unlike most, is not inherently bullish or bearish. Instead, it signals a consolidation period. Once price breaks out above or below the two converging trendlines that form the pattern, sharp changes in price tend to occur.
In order to determine a price target, technical analysts generally take the ‘height’ of the triangle at its beginning and add it to the level where price moved beyond a trendline. The longer a pattern takes to develop, the more significant the breakout tends to be.
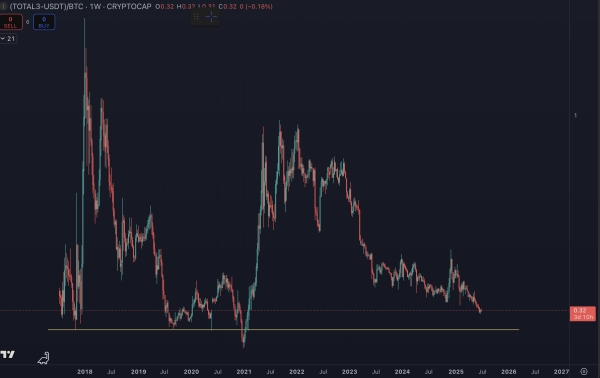
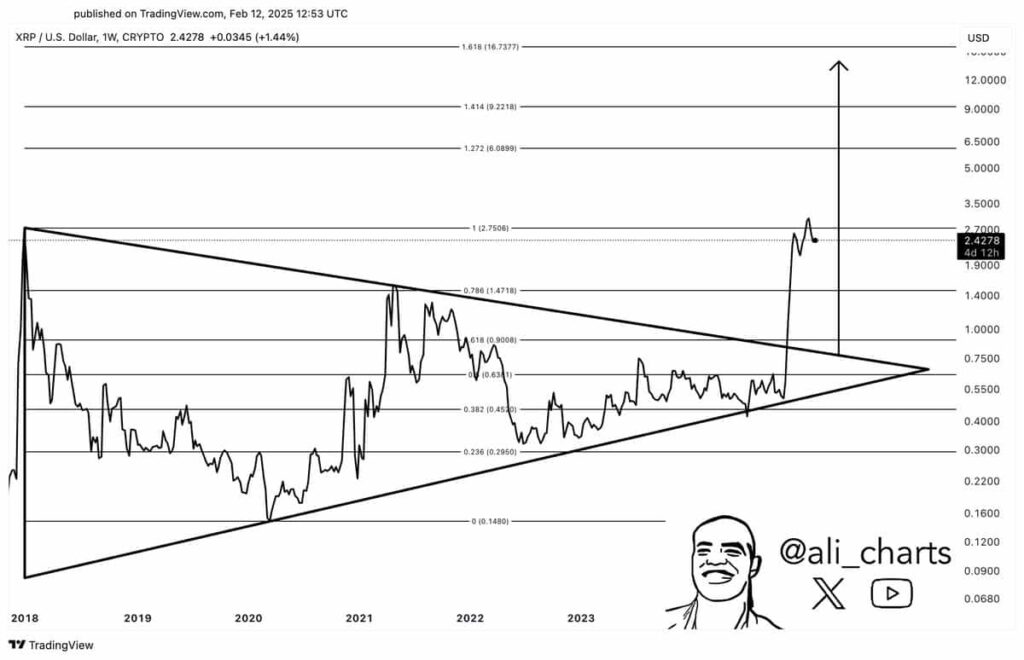 XRP price chart with symmetrical triangle pattern. Source: Ali Martinez on X
Since the analyst identified the triangle on a long-term chart—where the pattern seemingly began forming during XRP’s 2018 peak, he expects the resulting move to be quite substantial.
To be more precise, with the chart in question, the price target works out to approximately $15 — a figure that would entail a massive 512.24% increase from the current price of XRP. If met, this mark would also represent a level 368.75% higher than the digital asset’s all-time high (ATH) price of $3.20, reached on January 18.
Readers should note, however, that Martinez did not opine as to when the price target could be reached. In addition, while useful, technical analysis only provides a look into one facet of market dynamics. Increasing competition, macroeconomic pressures, or a host of other developments could serve to effectively invalidate the pattern.
Featured image via Shutterstock