Here’s why analysts think Bitcoin’s bull flag could spark a rally in Q4 2024
Here’s why analysts think Bitcoin’s bull flag could spark a rally in Q4 2024 
![]() Cryptocurrency Aug 23, 2024 Share
Cryptocurrency Aug 23, 2024 Share
Bitcoin (BTC) has experienced a remarkable start to 2024, with its price rising by over 42% year-to-date. This surge has been driven by several key factors, including the introduction of United States spot exchange-traded funds (ETFs) and anticipation surrounding the halving event.
In contrast to previous cycles, Bitcoin has reached new all-time highs before the halving, leading analysts to anticipate further gains within this halving year.
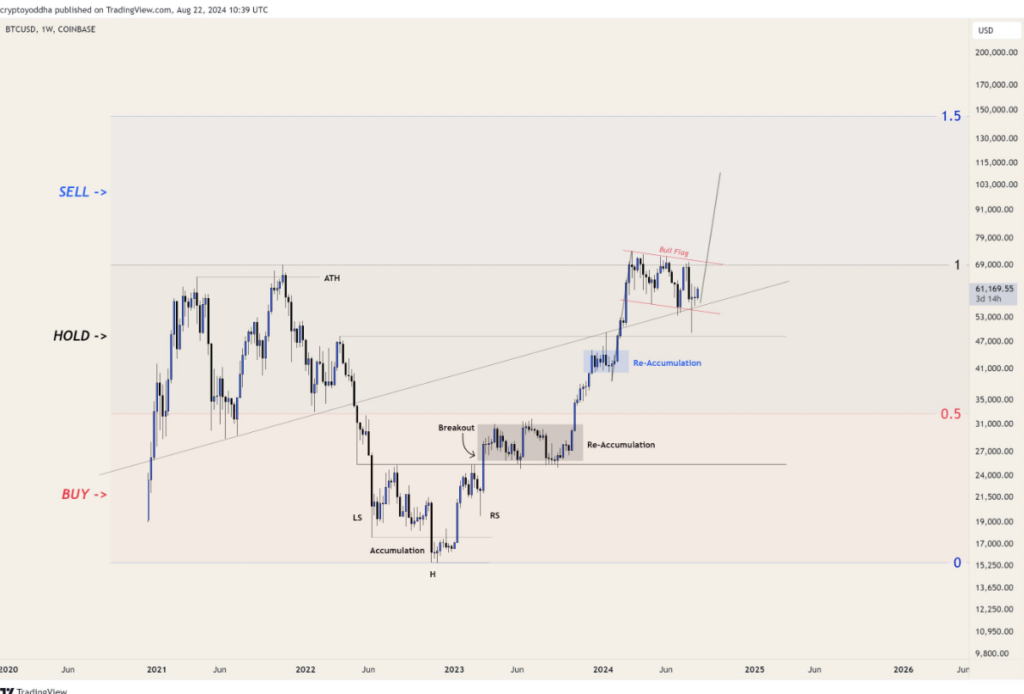
Notably, in a recent analysis shared by crypto analyst Yoddha on August 22, Bitcoin’s price action has been forming a significant bull flag pattern over the past few months.
Picks for you
This price range is Bitcoin's next stop, according to analyst 35 mins ago R. Kiyosaki reveals differences between investing in Bitcoin and real estate 50 mins ago Crypto trader turns $1.5 million in $4.5 million in 5 hours 2 hours ago Analyst sets XRP new price targets ahead of 'pure fireworks' 2 hours ago
The bull flag is a classic technical analysis pattern that typically appears after a strong upward move. The pattern is completed when the price breaks out above the upper trendline of the flag, signaling a continuation of the previous uptrend.
 Bitcoin price analysis chart. Source: TradingView
As of late August 2024, Bitcoin has been struggling to convincingly break the $60,000 psychological level, showing signs of consolidation after a strong move up earlier in the year.
This overall pattern is often considered as a bullish continuation signal, suggesting that the current consolidation phase could lead to a substantial rally in Q4 2024.
Potential rally and key levels to watch
According to the analysis, the bull flag formed after the price surged from the re-accumulation zone around $31,000 earlier this year.
Analysts view the current consolidation within the flag as a healthy correction, allowing the market to gather momentum for the next leg up.
The bull flag pattern is currently forming within the “Hold Zone,” which spans from around $35,000 to $70,000. This zone is critical for Bitcoin’s next move, as it represents a period of consolidation and re-accumulation.
Above this level is the “Sell Zone,” which covers price levels over $70,000. Should Bitcoin break out as expected, it may enter this zone, where traders might consider taking profits, especially if the price approaches the anticipated upper target near $150,000.
Given the current setup, analysts are targeting a potential rally toward the $100,000 mark and beyond. The breakout from the bull flag is expected to push Bitcoin into a new accumulation phase.
Key support levels to watch include the $53,000 mark, which aligns with the lower boundary of the re-accumulation zone. A breakdown below this level could invalidate the bullish outlook and signal a deeper correction.
Historical Q4 performance and market sentiment
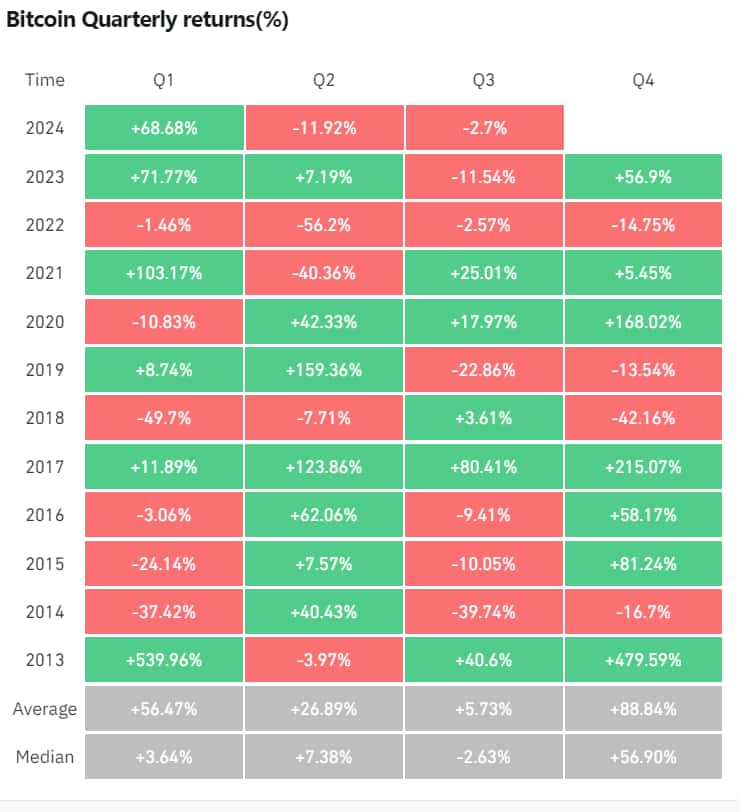
Historically, Bitcoin has exhibited strong performance in the fourth quarter of halving years. Data from CoinGlass shows that during halving years like 2016 and 2020, Bitcoin achieved impressive gains of 58% and 168% in Q4, respectively.
 Bitcoin quarterly returns(%). Source: Coinglass
Additionally, Bitcoin has posted positive returns in eight out of the 11 years between 2013 and 2023, with an average Q4 gain of 88%.
This historical trend, combined with the current technical setup, suggests that Q4 2024 could see Bitcoin once again rallying, possibly setting new all-time highs.
Aligning with this observation, CryptoQuant founder and CEO Ki Young Ju analyzed Bitcoin’s price action during the 2020 halving and found that the rally began in quarter four (Q4).
According to Ju, Bitcoin’s current price action suggests that it is in an accumulation phase, which often leads to a parabolic uptrend, with the fourth quarter historically being the launchpad for such rallies.
The broader market sentiment remains cautiously optimistic as Bitcoin continues to hold above critical support levels. The ongoing re-accumulation phase suggests that investors are accumulating Bitcoin at these levels, anticipating a significant rally.
Bitcoin price analysis
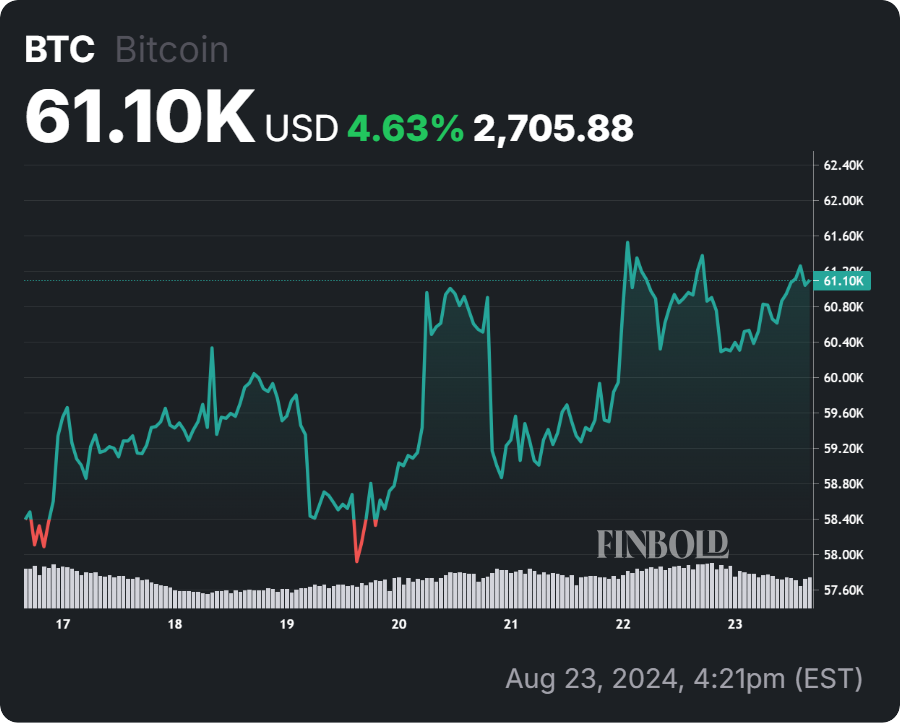
At the time of reporting, Bitcoin was trading at $61,073, with a gain of over 0.42% on the daily timeframe. On the weekly chart, BTC is also up by over 4%.
 Bitcoin seven-day price chart. Source: Finbold
The combination of Bitcoin’s bull flag formation, its position within key strategic zones, and its historical performance in Q4 during halving years all suggest that Bitcoin may be poised for a significant rally in Q4 2024.
As Bitcoin consolidates in the Hold Zone, traders are anticipating a possible breakout that could drive the price toward new highs.
With these factors in play, Q4 2024 could be a pivotal period for Bitcoin, offering substantial opportunities for investors and traders alike.
Disclaimer: The content on this site should not be considered investment advice. Investing is speculative. When investing, your capital is at risk.


