Imminent BTC price breakout; Bitcoin forming path to $350,000 spike
Imminent BTC price breakout; Bitcoin forming path to $350,000 spike 
![]() Cryptocurrency Sep 29, 2024 Share
Cryptocurrency Sep 29, 2024 Share
As Bitcoin (BTC) seeks to reclaim the $70,000 resistance, a prominent analyst has suggested there is room for more excitement as the maiden cryptocurrency is building momentum toward a six-figure record high.
Precisely, the analyst has termed the current price movement as ‘noise’ and indicated that a larger move is likely brewing, pointing out that the asset is forming a cup-and-handle pattern, as Ali Martinez stated in an X post on September 29.
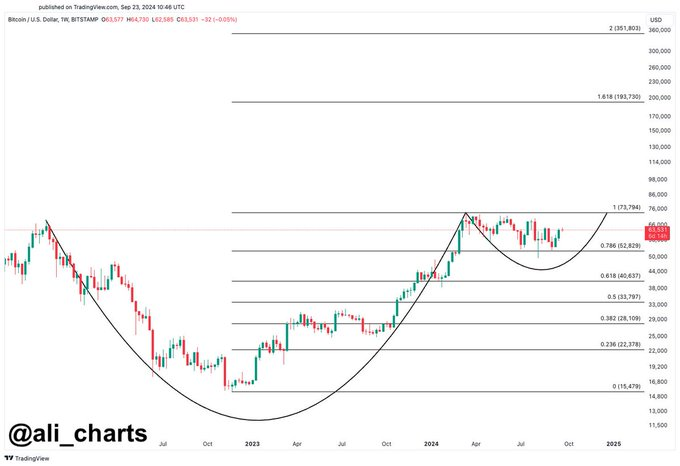 Bitcoin price analysis chart. Source: TradingView/Ali_Charts
As a reminder, the cup-and-handle formation is among the most bullish chart patterns. It emerges when an asset’s price follows a rounded, concave trajectory followed by a smaller consolidation period before breaking out to the upside.
Picks for you
China's stock market has gone parabolic this week; Will others follow? 3 hours ago Ripple to unlock 1 billion XRP on October 1; What’s next? 5 hours ago OpenAI o1 predicts Bitcoin price for the 2024 'Uptober' 7 hours ago Beware: Cryptocurrencies to unlock $300 million supply this week 9 hours ago
Bitcoin price targets
At the moment, Bitcoin’s price appears to have retraced to the 0.786 Fibonacci level, a key area that could serve as support before the next move up. Martinez suggested that once Bitcoin breaks this pattern, it could rally between $194,000 and $352,000.
The analysis also highlighted multiple retracement levels, with the price hovering above 0.786. Historically, breaks from these zones often lead to accelerated price increases. The most significant target is the 1.618 Fibonacci extension at $194,720, though Martinez’s analysis opens the possibility of an ultimate price spike toward $350,000.
Elsewhere, another crypto analyst using the pseudonym CrypNuevo noted in an X post on September 29 that the current market structure for Bitcoin shows that significant resistances need to be broken before traders can confidently anticipate a record high.
The two resistance levels are $65,700 and $70,000, hindering Bitcoin’s continued upward momentum. A full breakthrough past these levels would signal a structural change in the market.
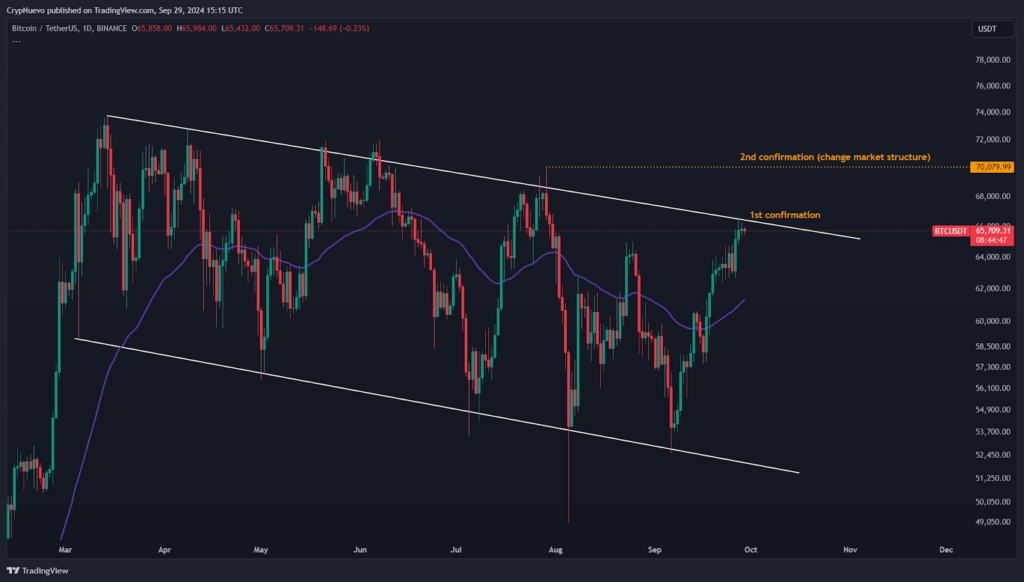 Bitcoin price analysis chart. Source: TradingView
Despite the optimism, the expert noted that the market remains dominated by traders, where liquidation heatmaps reveal some liquidity to the upside, aligning with the projected bullish move.
Although Martinez has pointed out that the current Bitcoin price is ‘noise,’ concerns remain about the short-term price trajectory. For instance, online interest in the cryptocurrency remains shaky.
As reported by Finbold, only a tiny section of the market is signaling bullish sentiments, and history suggests that such a scenario could lead to an imminent price drop.
Bitcoin price analysis
Bitcoin was trading at $65,846 at press time, having gained less than 0.1% in the last 24 hours. On the weekly chart, Bitcoin remains green, having gained 4.6%.
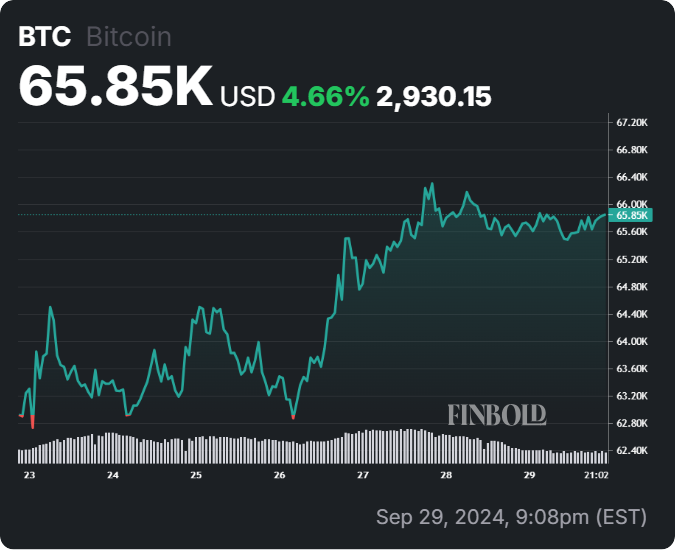 Bitcoin seven-day price chart. Source: Finbold
By all measures, Bitcoin seems poised to end September on a strong note, with momentum building the foundation for the ‘Uptober’ effect. However, the focus should be on how Bitcoin interacts with the $65,000 support level, as a sustained movement in either direction could be impactful.

