It’s getting ‘exciting’ as this XRP structure sets next target at $8
It’s getting ‘exciting’ as this XRP structure sets next target at $8 
![]() Cryptocurrency Feb 5, 2025 Share
Cryptocurrency Feb 5, 2025 Share
As XRP consolidates below the $3 mark, a cryptocurrency analyst has noted that the asset’s technical structure hints at a possible rally toward the $8 level.
Specifically, the current XRP consolidation serves as a breakeven point for further gains, and once the $3 resistance is breached, the next target could exceed $5, according to pseudonymous analyst Dark Defender in an X post on February 4.
Once this resistance is broken, the bullish wave structure suggests a strong push toward $5.85, with the final fifth wave aiming for levels above $8.
Picks for you
Bitcoin analyst predicts BTC will hit this price as bullish pattern unfolds 58 mins ago World Mobile teams up with DITO CME to promote blockchain connectivity in Philippines 4 hours ago AI predicts Shiba Inu (SHIB) price for February 28, 2025 5 hours ago $9 trillion of US debt will mature in 2025; Should investors be worried? 22 hours ago  XRP price analysis chart.Source: Dark Defender
The analysis is based on the Elliott Wave structure, which projects the third wave reaching approximately $5.85, while the fifth wave is anticipated to push XRP beyond $8. This formation suggests a strong bullish continuation if XRP successfully breaks through the critical $3 level.
“This structure aims at $8+ levels with its 5th Wave shortly. It has started to get exciting,” the expert said.
If XRP trades at $8, its market cap would be approximately $462.21 billion, making it the second-ranked cryptocurrency just behind Bitcoin (BTC).
XRP price levels to watch
Another analysis by pseudonymous trading expert CasiTrades shared in an X post on February 5 suggested that XRP’s recent drop, which coincided with broader market sentiment, may represent its last low before a rebound.
Despite a prolonged sell-off extending beyond initial projections, the analyst noted that the overall technical outlook remains unchanged, with key downside support targets at $2.16, $1.87, and $1.53.
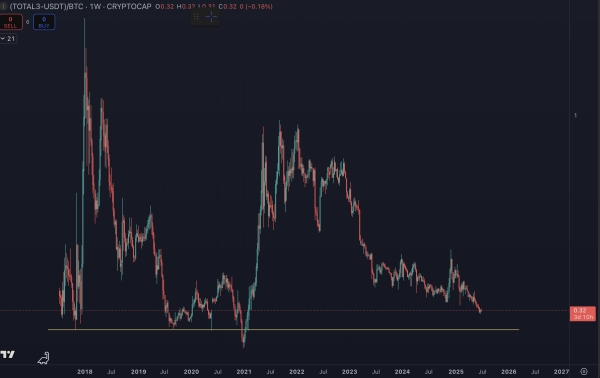
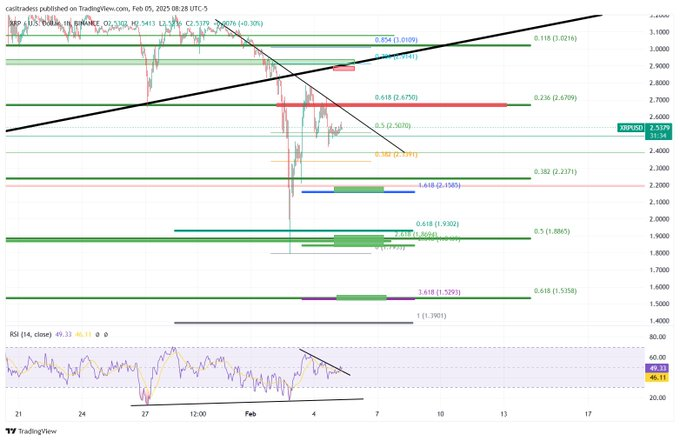 XRP price analysis chart.Source: TradingView
The analyst stated that XRP is in the fifth C wave within an ABC correction, forming a large Wave 2. If this is the final low, a massive Wave 3 uptrend could follow, potentially pushing XRP past its previous all-time highs with minimal resistance.
Beyond the technical aspects, XRP investors also consider other fundamental factors that could impact the Ripple-affiliated asset. For instance, prices remain subdued amid reports that Ripple plans to flood the market with an $800 million XRP sell-off in February, which could trigger volatility.
XRP price analysis
At press time, XRP was trading at $2.50, down over 5% in the last 24 hours. On the weekly chart, the token has plunged more than 18%.
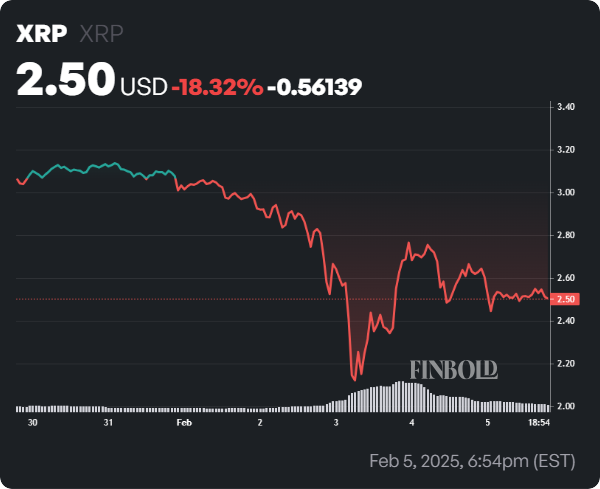 XRP seven-day price chart. Finbold
At its current price, XRP remains under bearish pressure, as it is trading below the 50-day simple moving average (SMA). However, the token remains bullish in the long term, as its price is still above the 200-day SMA of $1.27.
With a volatility of 11.77% and a relative strength index (RSI) of 41.38, the market appears neutral to slightly oversold.
Featured image via Shutterstock