Monster insider trading alert for Ethereum; Incoming crash?
Monster insider trading alert for Ethereum; Incoming crash? 
![]() Cryptocurrency May 20, 2025 Share
Cryptocurrency May 20, 2025 Share
Jeffrey Wilcke, one of Ethereum’s (ETH) original co-founders, has executed a major transaction, transferring over $260 million, a move that could trigger volatility in the asset.
Wilcke moved 105,737 ETH, worth approximately $262 million, to the Kraken cryptocurrency exchange, representing nearly all of his Ethereum holdings, according to on-chain data retrieved by Finbold from Arkham Intel on May 20.
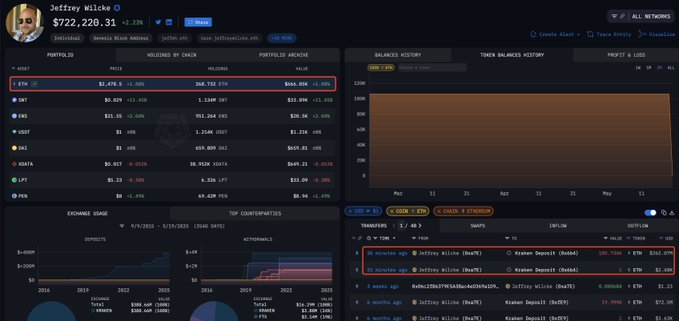 Jeffrey Wilcke ETH transactions. Source: Arkham Intel
Historically, large transfers, mainly from insiders to centralized exchanges, have preceded increased market volatility.
Wilcke has made similar moves before, notably on November 28, 2024, when he deposited ETH to Kraken while the token traded at $3,625.
Possible ETH price volatility
The timing of this deposit comes as Ethereum remains one of the best-performing digital assets in recent weeks, supported by broader market sentiment and renewed investor confidence following network upgrades.
If Wilcke sells his ETH directly on Kraken, the resulting sell pressure could lead to a short-term price dip. However, if the funds remain untouched or are sold over the counter, the impact may be minimal, and prices could stabilize quickly.
It’s also worth noting that this potential volatility comes amid bullish on-chain signals. Specifically, according to Cryptorank, Ethereum’s supply on centralized exchanges has dropped from over 18 million to 17 million coins in the past month, about 5.5% of the total exchange-held ETH.
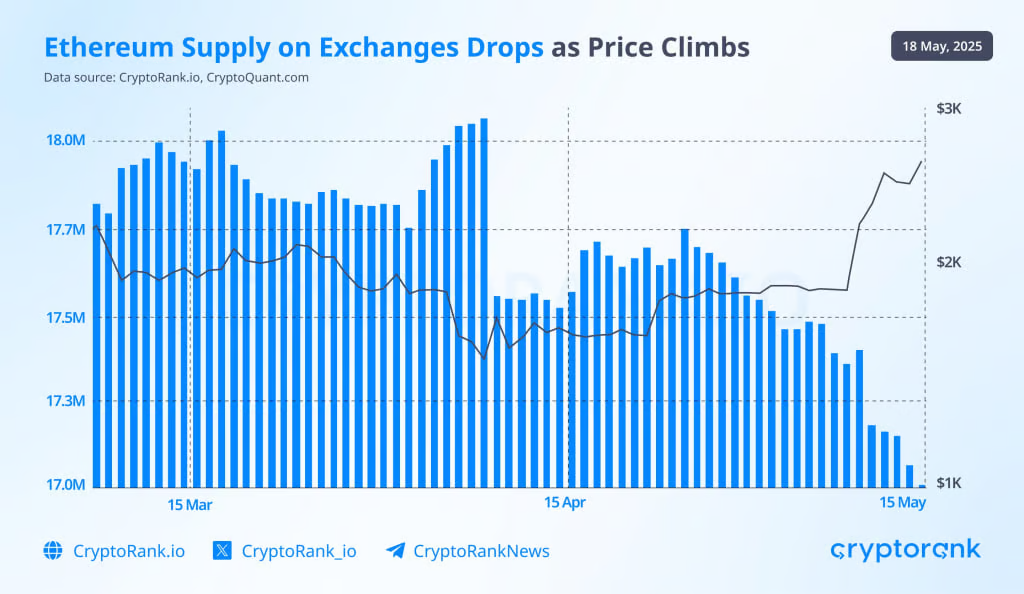 ETH supply on exchanges chart. Source: Cryptorank
This reduction often correlates with upward price pressure, as fewer tokens are immediately available for sale.
Additionally, this trend aligns with Ethereum’s recent Pectra upgrade, launched on May 7, which introduced improvements in scalability, security, and user experience.
Ethereum price analysis
As of press time, Ethereum was trading at $2,473, up 0.5% over the last 24 hours but down 3.5% for the week.
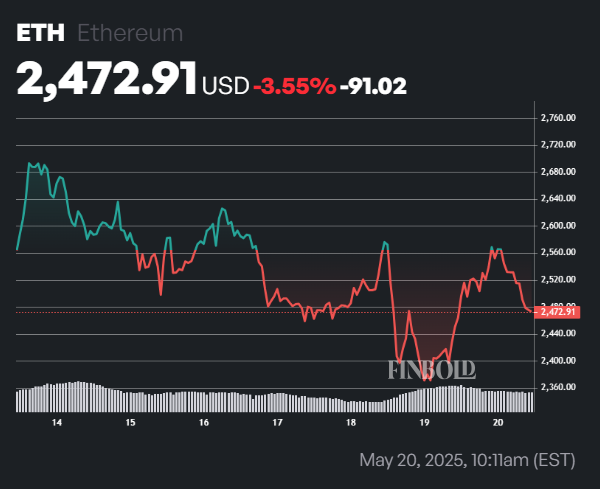 ETH seven-day price chart. Source: Finbold
The asset is presenting a mixed technical outlook, trading above its 50-day simple moving average (SMA) but just below the 200-day SMA, indicating slight long-term weakness.
Meanwhile, the relative strength index (RSI) stands at 68, approaching overbought territory and suggesting possible short-term volatility.
Featured image via Shutterstock