New ATH Incoming? Analyst Reveals Why Bitcoin’s Next Rally Is Around the Corner
Bitcoin has been in a consolidation phase since its renewed peak above $73,000 in March. However, many experts in the crypto space are eyeing potential signs of a breakout that could lead to a new all-time high (ATH).
A renowned crypto analyst, Mags, for instance, recently shared his insights on Bitcoin’s outlook, noting patterns that have emerged in the past and how they might affect the crypto asset’s future.
Bullish Signals In Bitcoin Consolidation
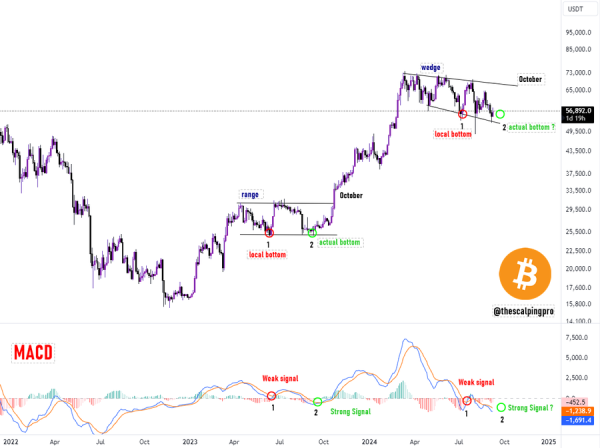
According to Mags, Bitcoin’s current price action mirrors its behavior during last year’s consolidation period. He emphasized the importance of the Moving Average Convergence Divergence (MACD) indicator, a tool analysts use to gauge momentum shifts.
#Bitcoin new ATH incoming ?
The current consolidation looks a lot like what happened last year when Bitcoin stayed in a range for several months.
The first bullish MACD crossover gave a weak signal, causing a short term pump, but price couldn’t break out of the range.… pic.twitter.com/09osi0GEfF
— Mags (@thescalpingpro) September 10, 2024
Mags highlighted that last year, the first bullish MACD crossover was followed by a short-term rally, but the price failed to break out of its range.

However, the second bullish MACD crossover led to a significant breakout and subsequent price surge. Mags believes we could witness the same scenario again, potentially setting the stage for a new ATH.
The analyst particularly noted:
We might see the same pattern play out again. The first signal was weak and created a short-term bottom, but the second one might lead to a real breakout and a new ATH.
$73,000 And Beyond
While Mags used the MACD indicator to gauge how near a major Bitcoin rally might be, another crypto analyst, Javon Marks, has also recently shared his outlook on the crypto. However, his view connected more to a technical chart pattern than an indicator.
According to Marks analysis, Bitcoin’s price chart has formed a ‘hidden bullish divergence’, which the asset has been trading within for months. Marks mentioned that the target for this pattern is Bitcoin rallying to as high as $73,729.79 and even seeing a “major continuation” after reaching this mark.
The target for this #Bitcoin (BTC) Pattern is at,
$73,729.79
and a major continuation above is more than possible.
The Pattern is a “Hidden Bullish Divergence”. https://t.co/y1LciVBNSI pic.twitter.com/IH0mppoo77
— JAVON⚡️MARKS (@JavonTM1) September 10, 2024
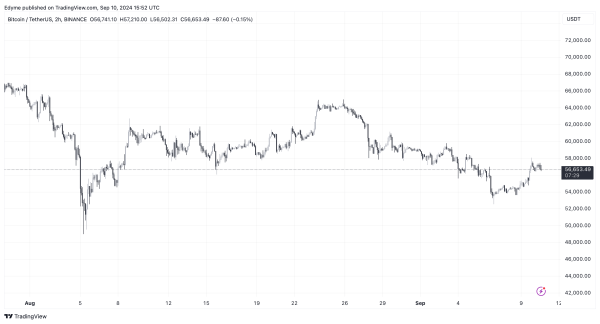
However, so far, Bitcoin is still far from this target, indicating that the asset might still have a long way to go. Particularly, the latest data shows the asset currently trades for $56,851, at the time of writing, up by 2.6% in the past 24 hours.

Featured image created with DALL-E, Chart from TradingView


