This historical pattern points to a new Dogecoin ‘price run’; Is $2 next
This historical pattern points to a new Dogecoin ‘price run’; Is $2 next 
![]() Cryptocurrency Dec 26, 2024 Share
Cryptocurrency Dec 26, 2024 Share
Although Dogecoin (DOGE) is experiencing short-term bearish sentiment, historical price movement suggests the meme coin could be building up for a potential rally toward a single-digit valuation.
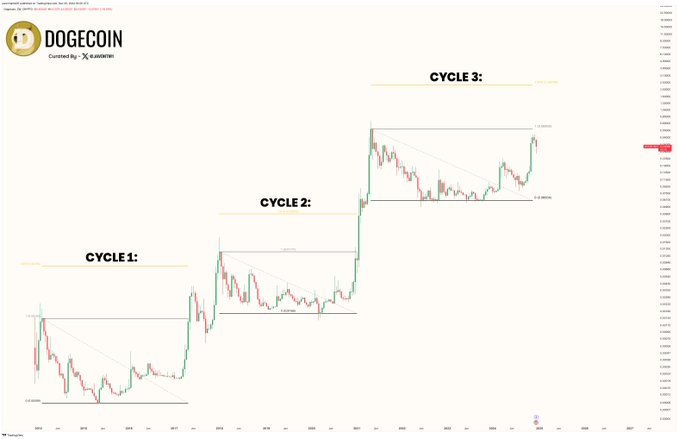
Over the years, Dogecoin’s price action has been defined by three distinct cycles, each characterized by extended periods of consolidation within symmetrical triangle formations, followed by breakouts, according to an analysis shared by Javon Marks in an X post on December 25.
From 2014 to 2017, Dogecoin broke out of consolidation and exceeded the 1.618 Fibonacci Extension, setting a precedent for exponential growth. The 2018 to 2021 cycle mirrored this behavior, with DOGE breaking resistance and surpassing the 1.618 Fib level during its dramatic 2021 rally.
Picks for you
4 altcoins to buy under $0.10 for the start of 2025 1 hour ago Sui Network to unlock $300 million of SUI on January 1, 2025 – What’s next? 1 hour ago XRP price prediction for 2025 3 hours ago AI predicts Polygon price as Aave threats to leave the blockchain 4 hours ago  DOGE historical price analysis chart. Source: TradingView
The current analysis indicates that Dogecoin is in its third cycle, which began in 2022. Over the past two years, a symmetrical triangle has been formed while testing key resistance.
If this trend continues, the expert projects that DOGE could reach $2.28 or higher, representing a potential increase of over 500%.
“The history hasn’t changed and still points to a fairly high likeliness of a price run to AND ABOVE the 1.618 Fib Extension level as it did every cycle prior to this and this time around,” the analyst said.
Such a move would bring Dogecoin’s market cap to approximately $342 billion, potentially ranking it among the top three digital assets, assuming minimal growth in other cryptocurrencies.
More bullish potential for DOGE
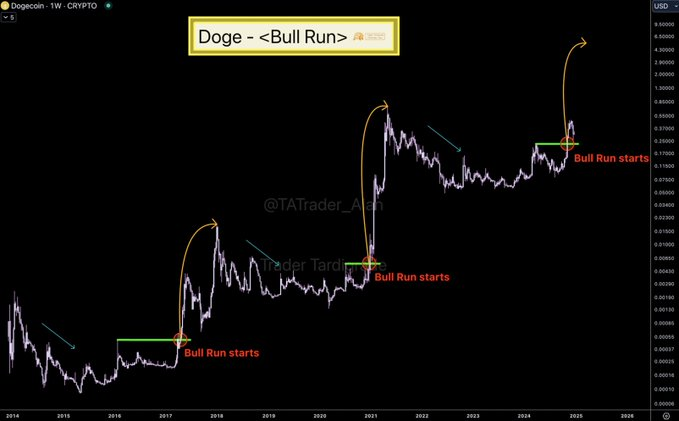
This analysis aligns with insights shared by another cryptocurrency trading expert, Trader Tardigrade, in an X post on December 26. The technical analysis also highlighted Dogecoin’s repeating cycles of consolidation followed by parabolic price surges.
 DOGE historical price analysis chart. Source: Trader Tardigrade
The latest setup suggests Dogecoin has emerged from its accumulation phase, a signal that has previously triggered exponential price movements.
Similar patterns in 2017, 2021, and now 2024 hint that DOGE could be gearing up for another major run, possibly surpassing its all-time highs.
Interestingly, on-chain data points to underlying bullish factors for Dogecoin despite its near-term weakness.
Particularly, cryptocurrency analyst Ali Martinez noted in a December 24 X post that whale investors accumulated 270 million DOGE—worth approximately $89.64 million—within 96 hours. Historically, such large transactions have often preceded notable price rallies.
Whales bought 270 million #Dogecoin $DOGE in the last 96 hours! pic.twitter.com/b86lCyGDsr
— Ali (@ali_charts) December 24, 2024
Generally, Dogecoin has benefited from the broader cryptocurrency market rally, fueled by optimism surrounding Donald Trump’s election. Trump is regarded as the first pro-crypto president, having promised to support the sector during his campaign.
DOGE price analysis
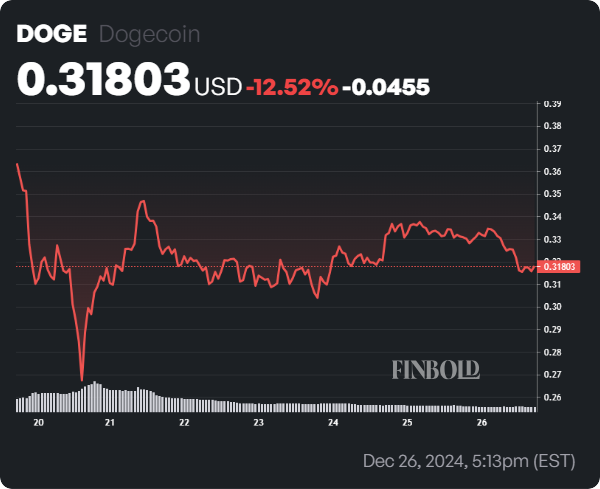
At press time, DOGE was trading at $0.31803, down nearly 5% on the daily chart and 13% over the past week.
 DOGE seven-day price chart. Source: Finbold
While its historical price trends point to a potential breakout, the short-term outlook remains bearish. Currently, DOGE is trading below its 50-day simple moving average (SMA), signaling near-term weakness but well above the 200-day SMA, reflecting a longer-term bullish outlook.
Dogecoin’s relative strength index (RSI) at 43.60 suggests mild bearish momentum, while the Fear & Greed Index at 73 indicates strong market interest.
Featured image via Shutterstock

