Why Bitcoin’s next bullish target could be $255,000
Why Bitcoin’s next bullish target could be $255,000 
![]() Cryptocurrency Nov 13, 2024 Share
Cryptocurrency Nov 13, 2024 Share
Bitcoin’s (BTC) ongoing bullish momentum shows no signs of cooling down, with a trading expert suggesting the asset may be primed for a six-figure valuation.
This outlook comes as Bitcoin hit another record high, briefly clinching the $93,000 mark for the first time.
According to cryptocurrency trading expert Ali Martinez, Bitcoin is aligning with the bullish ‘cup-and-handle’ pattern, signaling an upcoming sustained rally targeting a high of $255,000, as noted in his X post on November 13.
Picks for you
XRP price breakout in the cards as multi-year resistance falls 10 hours ago These are the largest share buybacks in Q3 2024 11 hours ago Bitcoin is now exactly half the size of Nvidia in market value – What’s happening? 11 hours ago Over $1 billion inflows into Pnut in a day; Should you follow suit? 12 hours ago 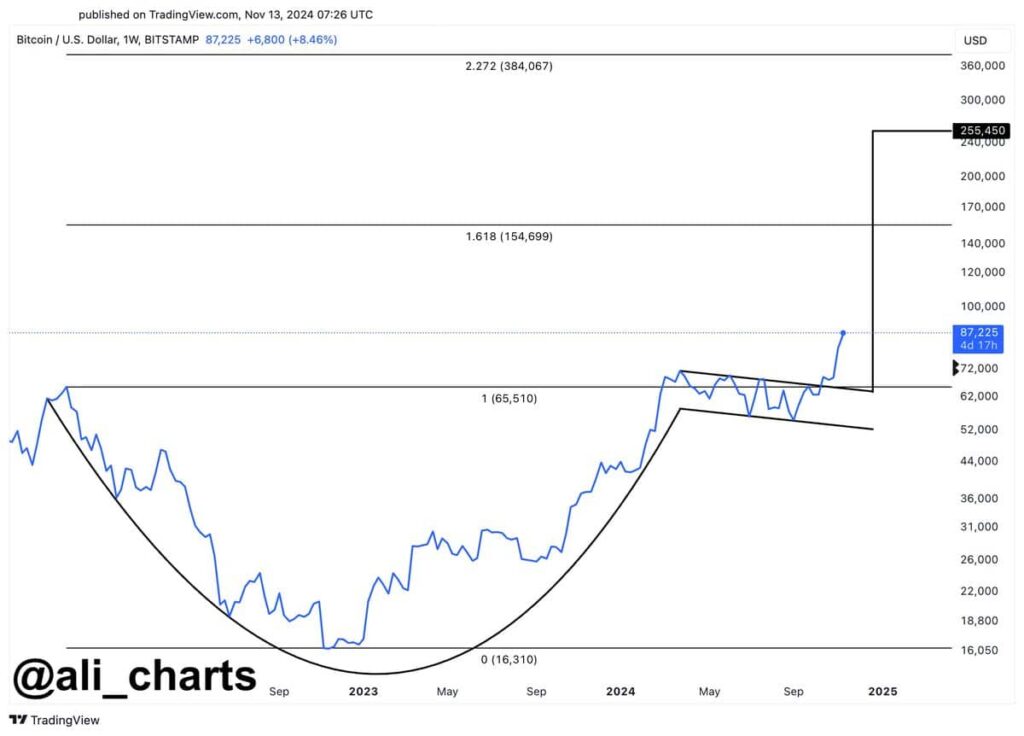 Bitcoin price analysis chart. Source: TradingView/Aliu_charts
The cup-and-handle pattern, a technical chart formation, often signals the continuation of a bullish trend after a period of consolidation. In this case, Bitcoin’s price shows a rounded bottom, followed by a short consolidation phase resembling a handle.
According to the analysis, significant Fibonacci levels highlight potential resistance points at $154,699 and $384,067, with the primary target at $255,000.
Bitcoin’s recent price increase to over $87,000 supports this bullish narrative, marking a pivotal level for traders to watch.
“If Bitcoin price action is following a cup-and-handle pattern, the bullish target could reach $255,000,” he said.
Bitcoin target above $200,000
In an X post on November 13, technical analyst Gert van Lagen also supported Bitcoin’s target of surpassing the $200,000 mark. According to Lagen, Bitcoin has adhered to a textbook pattern of accumulation and re-accumulation.
In this case, the maiden cryptocurrency has successfully broken out of a prolonged re-accumulation phase, decisively past resistance levels. The recent breakout suggests a new phase of higher highs and higher lows, with projections placing the target range between $220,000 and $320,000.
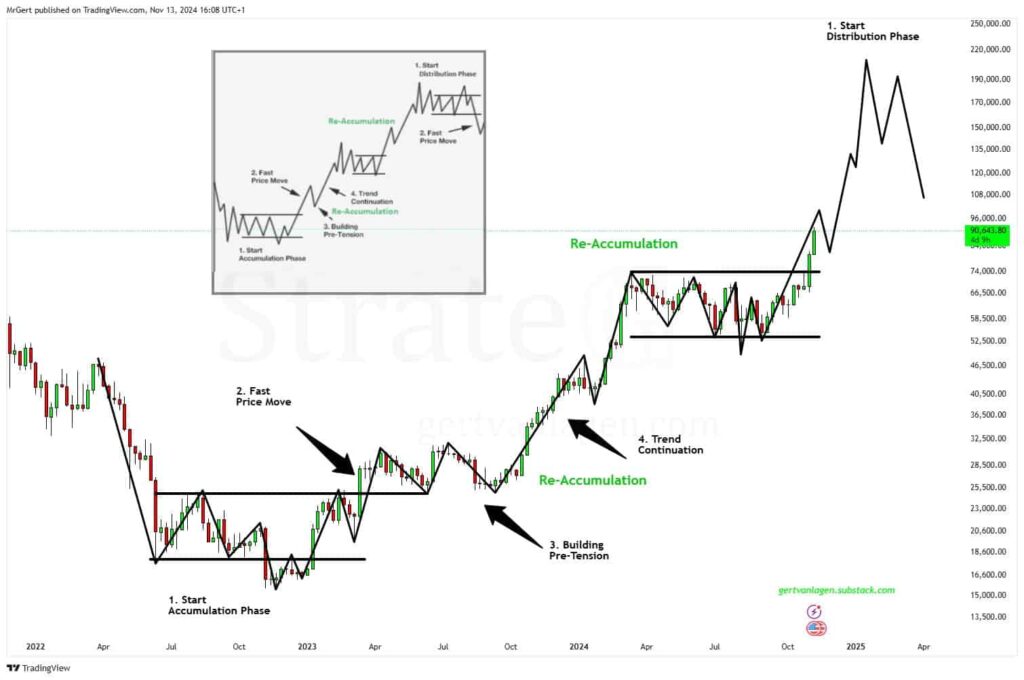 Bitcoin price analysis chart. Source: TradingView
Notably, breaching the $100,000 resistance is now Bitcoin’s primary target, with most market players optimistic that this level is attainable.
Some analysts expect Bitcoin’s rally, boosted by the United States’ post-election results, to continue until inauguration day.
This rally, aided by Donald Trump’s victory, has also spilled over to other asset classes related to Bitcoin. Consequently, stocks of Bitcoin mining companies and firms investing in Bitcoin, such as MicroStrategy (NASDAQ: MSTR), have rallied in tandem with the flagship digital asset.
The market was anticipating a possible pullback below that level following the October Consumer Price Index (CPI) release.
The CPI results revealed a 2.6% year-on-year increase, per analyst expectations. Notably, inflation remains stubbornly above the desired 2% figure, increasing the chances of an interest rate hike in December.
Bitcoin price analysis
Bitcoin was trading at $91,910 at press time, gaining over 5% in the past 24 hours, with a 25% increase on the weekly chart.
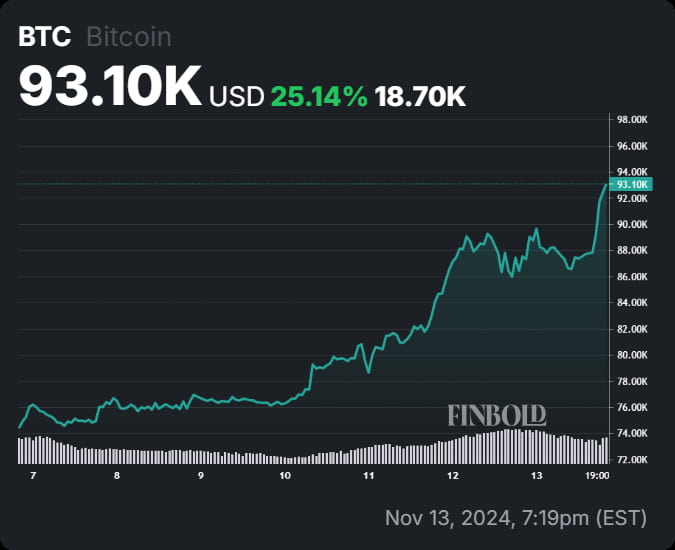 Bitcoin seven-day price chart. Source: Finbold
In summary, Bitcoin could reach $100,000 if it attains a daily close above $90,000.However, investors should exercise caution with the 14-day Relative Strength Index in the overbought territory, as momentum appears exhausted.
Featured image via Shutterstock


