XRP Bulls vs. Bears: Will $2 support stop a major crash?
XRP Bulls vs. Bears: Will $2 support stop a major crash? 
![]() Cryptocurrency Mar 17, 2025 Share
Cryptocurrency Mar 17, 2025 Share
XRP’s focus on fast, low-cost transactions has made it the third largest cryptocurrency in the world (excluding stablecoins) — and one of the main beneficiaries of the late 2024 rally.
However, at least thus far in 2025, macroeconomic challenges have proved dominant. The cryptocurrency market, in particular, has been shaken up by the risk asset selloff that’s going on due to the possible disruptions of the Trump administration’s tariff policies.
Yet despite recent challenges, XRP has performed better than most digital assets. At press time, XRP was changing hands at a price of $2.33, having marked a 12.21% gain on a year-to-date (YTD) basis after a 5.13% move to the upside in the past week.
Picks for you
Bitcoin whales hunt down a $430M BTC short of an insider trader — Who will win? 39 mins ago 2 overbought cryptocurrencies to avoid buying this week 19 hours ago XRP ‘setting up for a bull rally to $15’, says expert 22 hours ago XRP price prediction as number of addresses hits 7 million record high 2 days ago 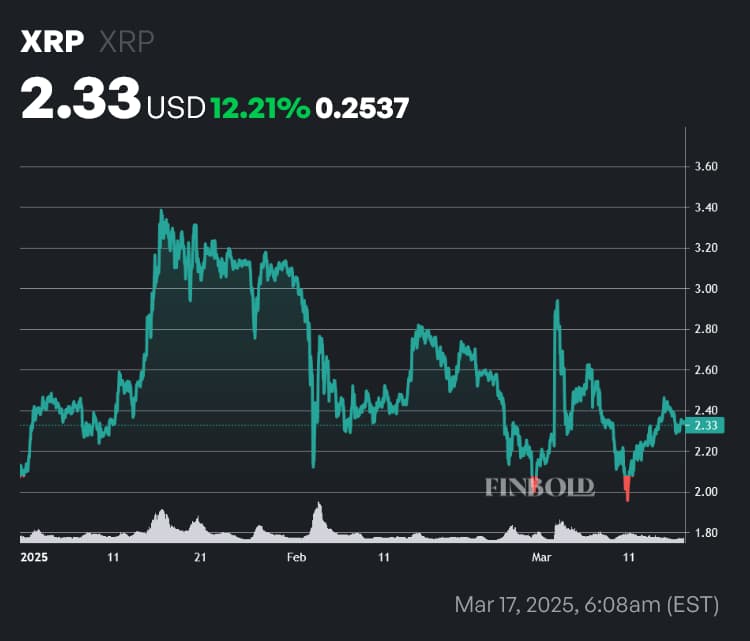 XRP price year-to-date (YTD) chart. Source: Finbold
However, price action does not occur in a vacuum. The token’s current price is dangerously close to a key support level — and a renowned technical analyst has outlined exactly what a crash below that level could entail.
A drop below $2 could lead to an XRP crash
XRP appears to be forming a head-and-shoulders chart pattern on the weekly chart, as highlighted by noted cryptocurrency technical analyst Ali Martinez in a March 17 X post.
$XRP is shaping up a head-and-shoulders on the weekly chart. It spotlights the $2 support. Holding it is crucial. pic.twitter.com/icoVFwbBB9
— Ali (@ali_charts) March 17, 2025
The head-and-shoulders pattern is a sign of reversal — indicating that the hitherto prevailing uptrend is coming to an end. This pattern consists of three peaks — the first and last of which are roughly equal and represent the ‘shoulders’, while the middle peak represents the head. The ‘neckline’ formed by the bottoms between the peaks acts as a level of support.
In this particular instance, that neckline is at the $2 level, roughly 14.16% below current prices. With a head-and-shoulders pattern, a successful breakout leads prices to drop to a point equal to the distance between the ‘neckline’ and the top of the ‘head’.
If the pattern is legitimate, prices moving below $2 could lead to an XRP crash which would see prices drop to approximately $1.25, for a combined drop of 46.35% compared to current prices.
Lastly, readers should be aware that Martinez’s chart is dated March 16, 11:54 UTC — but his post on X came a day later. While timing is certainly important in technical analysis, no major developments occurred between the chart date and the time of the post.
Escrow schedule could depress XRP prices despite widespread adoption
On the other hand, as reported by Finbold on March 15, XRP is seeing a steady increase in the number of addresses, which hit a record number of 7 million recently — which highlights an increasing rate of adoption and mainstream popularity.
Martinez also outlined a more bullish case — if XRP manages to break out past $3, its next major price target would be in the $4.80 to $5 range, followed by a possible rally to a new all-time high of $15. With that being said, readers should note that roughly $465 million in XRP has been moved from escrow holding, in a move that could present significant downward pressure on the asset’s price.
Featured image via Shutterstock