XRP whales go on another buying spree; Is $3 next?
XRP whales go on another buying spree; Is $3 next? 
![]() Cryptocurrency Dec 18, 2024 Share
Cryptocurrency Dec 18, 2024 Share
As XRP consolidates above the $2 support zone, whale transactions could provide the much-needed trigger to breach the $3 psychological resistance.
Specifically, large holders with addresses containing 100 million to 1 billion XRP acquired 30 million tokens in a 24-hour window, according to on-chain data shared by prominent cryptocurrency analyst Ali Martinez on December 17.
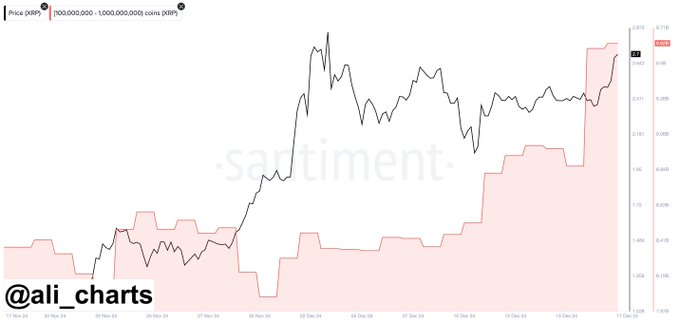 XRP whale transaction chart. Source: Santiment/Ali_charts
Indeed, this was the second consecutive day of whale accumulation for XRP. On December 16, Martinez also pointed out that the holders acquired 830 million XRP within 24 hours.
Picks for you
ChatGPT says Hedera (HBAR) will hit this target by December 31, 2024 45 mins ago SatLayer and Sui announce collaboration to kickstart BTCfi 1 hour ago Bitflow and Pontis bring Bitcoin Runes Automated Market Maker to Stacks 2 hours ago Economist slams Michael Saylor's MSTR-Bitcoin strategy as a ‘shell game’ 2 hours ago 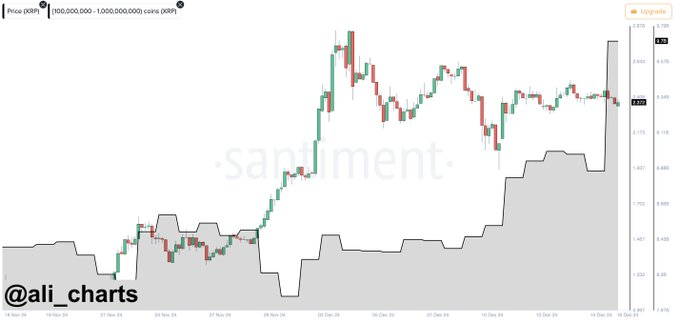 XRP whale transaction chart. Source: Santiment/Ali_charts
The buying spree coincides with the recent XRP price growth, and such accumulation has historically preceded substantial rallies.
XRP’s potential bull case
Meanwhile, Martinez had earlier highlighted the possibility of continuation in XRP’s price appreciation. He noted that once XRP breaks the $2.60 resistance, it could ‘head toward $4.’ This follows his December 12 analysis, in which he identified a bull flag pattern on the four-hour chart.
A bull flag is a continuation pattern marked by a sharp rally followed by consolidation within a downward-sloping channel. To this end, if the pattern is realized, XRP could hit a long-term target of $4.
A similar bullish outlook was observed by a cryptocurrency analyst with the pseudonym Dark Defender in an X post on December 18.
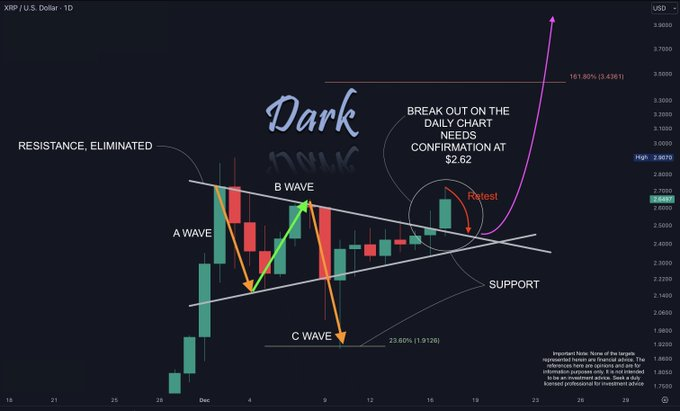 XRP price analysis chart. Source: Dark Defender
The analyst stated that XRP has broken out on the daily chart, signaling bullish momentum after rebounding from the $2.72 level. This move follows the completion of an A-B-C corrective wave, a reversal pattern indicating the end of a downtrend, and the start of a new upward move.
Additionally, the breakout from a descending triangle—a bullish continuation pattern—confirms XRP’s strength, with previous resistance now acting as support.
The expert projected that a potential retest of $2.42 may occur, as breakouts often revisit former resistance to establish a stronger base before continuing higher.
The Fibonacci extension at 161.8% projects a near-term target of $3.43. Fibonacci levels are used to identify potential price targets in trending markets, and clearing this level could open the path toward $5.85, the next significant extension.
Besides the technical indicators, XRP is backed by additional fundamentals, such as Ripple’s RLUSD stablecoin rollout. In this case, RLUSD transactions burn small amounts of XRP, linking the two assets, a move likely to drive further growth.
XRP price analysis
XRP was trading at $2.54 by press time, having plunged by over 4% in the last 24 hours. However, on the weekly chart, the asset remains in the green, up almost 7%.
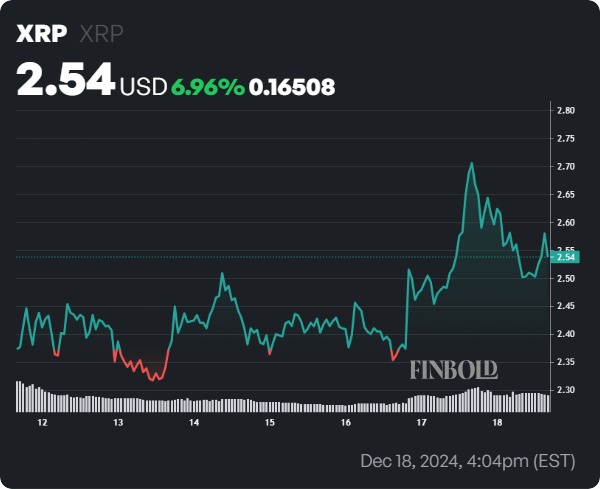 XRP seven-day price chart. Source: Finbold
Although XRP is exhibiting bearish sentiments in the short term, the overall market outlook remains bullish, supported by the current technical setup.
At the current valuation, the Ripple-affiliated asset is trading above the 50-day simple moving average (SMA) of $1.39 and the 200-day SMA of $0.75, signaling strong upward momentum both in the short and long term.
On the flip side, investors need to be wary of a possible price correction or consolidation for the short term, considering the 14-day relative strength index (RSI) stands at 68, approaching overbought territory.
Featured image via Shutterstock

