XRP’s push to $3 in jeopardy as pullback signal emerges
XRP’s push to $3 in jeopardy as pullback signal emerges 
![]() Cryptocurrency Feb 18, 2025 Share
Cryptocurrency Feb 18, 2025 Share
Technical indicators are suggesting that XRP might wait longer before reclaiming the $3 resistance, a level that has remained elusive recently.
Notably, the token is flashing a sell signal, with the TD Sequential indicator triggering a bearish warning on the daily chart, suggesting a potential pullback might be on the horizon, according to prominent cryptocurrency analyst Ali Martinez in an X post on February 18.
XRP is per the trading expert showing a TD Sequential ‘9’ sell signal, a pattern known for predicting trend exhaustion. Historically, this indicator is leveraged to anticipate short-term reversals, and in the case of XRP, sustained volatility could be on the horizon.
Picks for you
Jack Ma’s net worth revealed: How rich is the founder of Alibaba? 23 mins ago Solana crashes to a 3-month low wiping out billions 54 mins ago Here's why Goldman Sachs sees Gold hitting $3,100 by year-end 2 hours ago Liang Wenfeng net worth revealed: How rich is the CEO of DeepSeek? 4 hours ago
If selling pressure increases, Martinez suggests the key XRP support levels to watch include $2.50 and $2.35. However, if XRP holds above current levels and invalidates the TD Sequential signal, the next major resistance remains at $2.80 and $3.
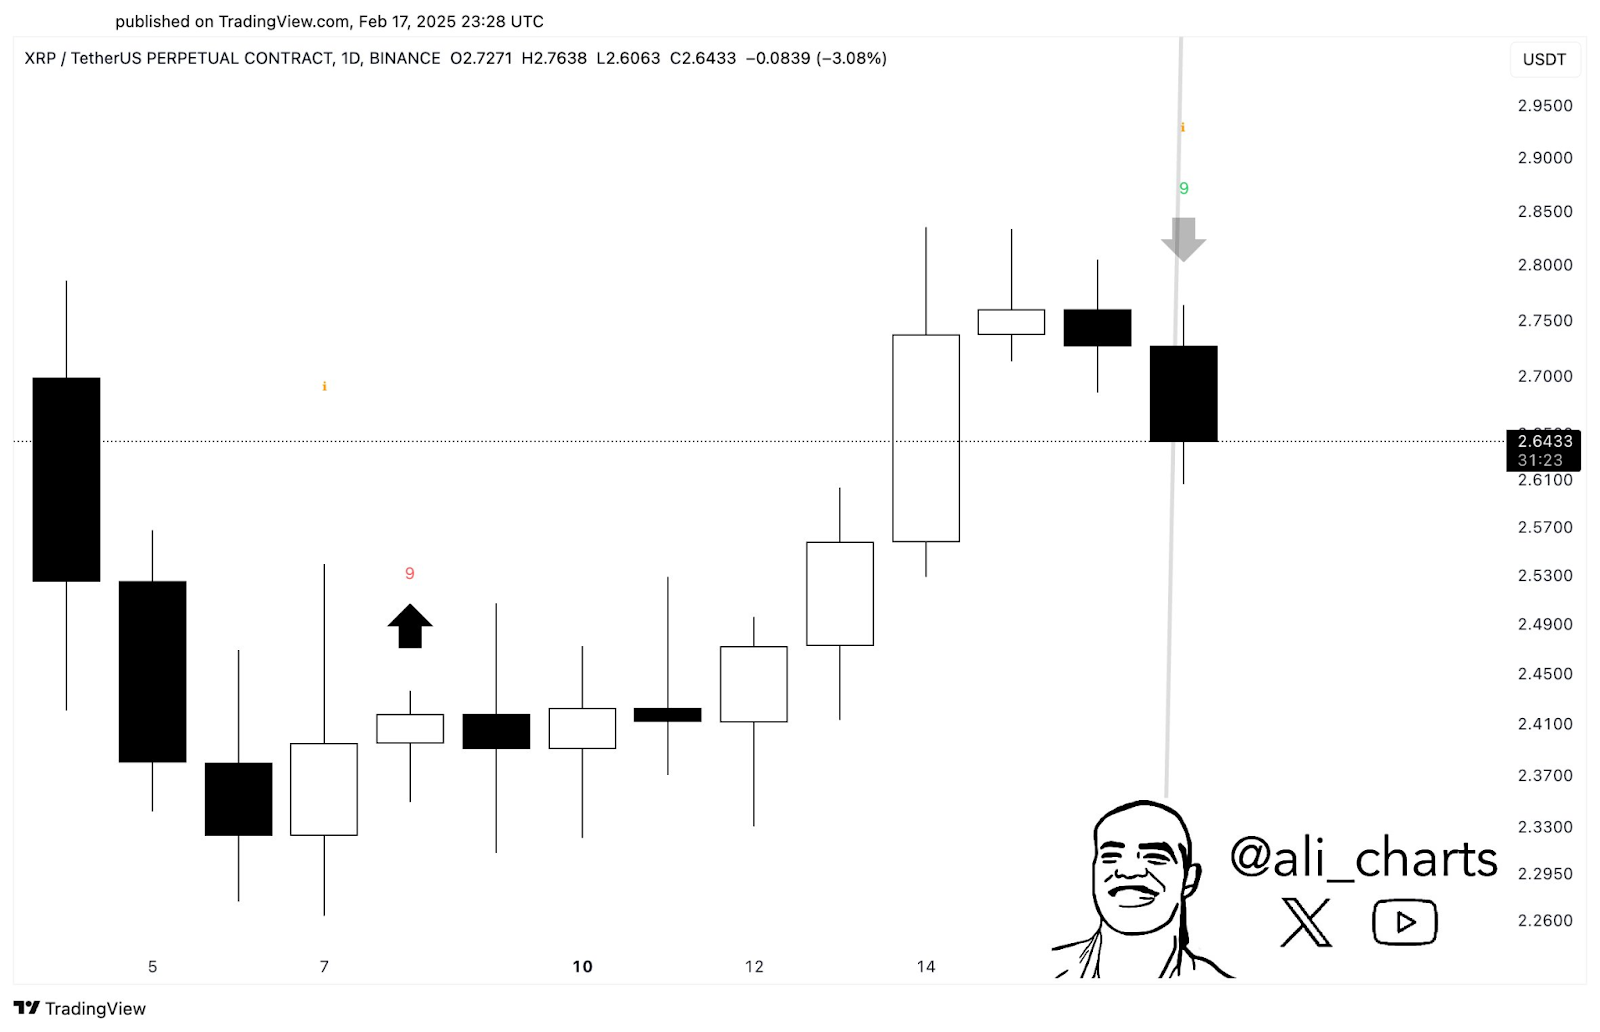 XRP price analysis chart. Source: TradingView/Ali_charts
Indeed, the asset has faced downward pressure recently, mostly aligning with the general cryptocurrency market sentiment.
XRP replicating 2017 price breakout
Meanwhile, while acknowledging XRP’s current struggles, cryptocurrency analyst Dark Defender stated in another X post on February 18 that the token’s long-term bullish setup looks intact.
The pseudonymous analyst noted that despite the sell-off, XRP is following a pattern similar to its 2017 breakout. After clearing two key resistance trendlines, it is now targeting levels above $5.
In this line, XRP recently broke past the $0.8462 resistance, aligning with the 70.7% Fibonacci retracement level, setting the stage for a potential rally. Key targets to watch include $3.8577 (2.618 Fibonacci) and $5.8554 (3.618 Fibonacci). If history repeats, XRP could see a parabolic surge like in 2017.
As reported by Finbold, the popular online trading expert, TradingShot also believes XRP is mirroring its 2017 run, with a potential target of $12.50 if the trend holds.
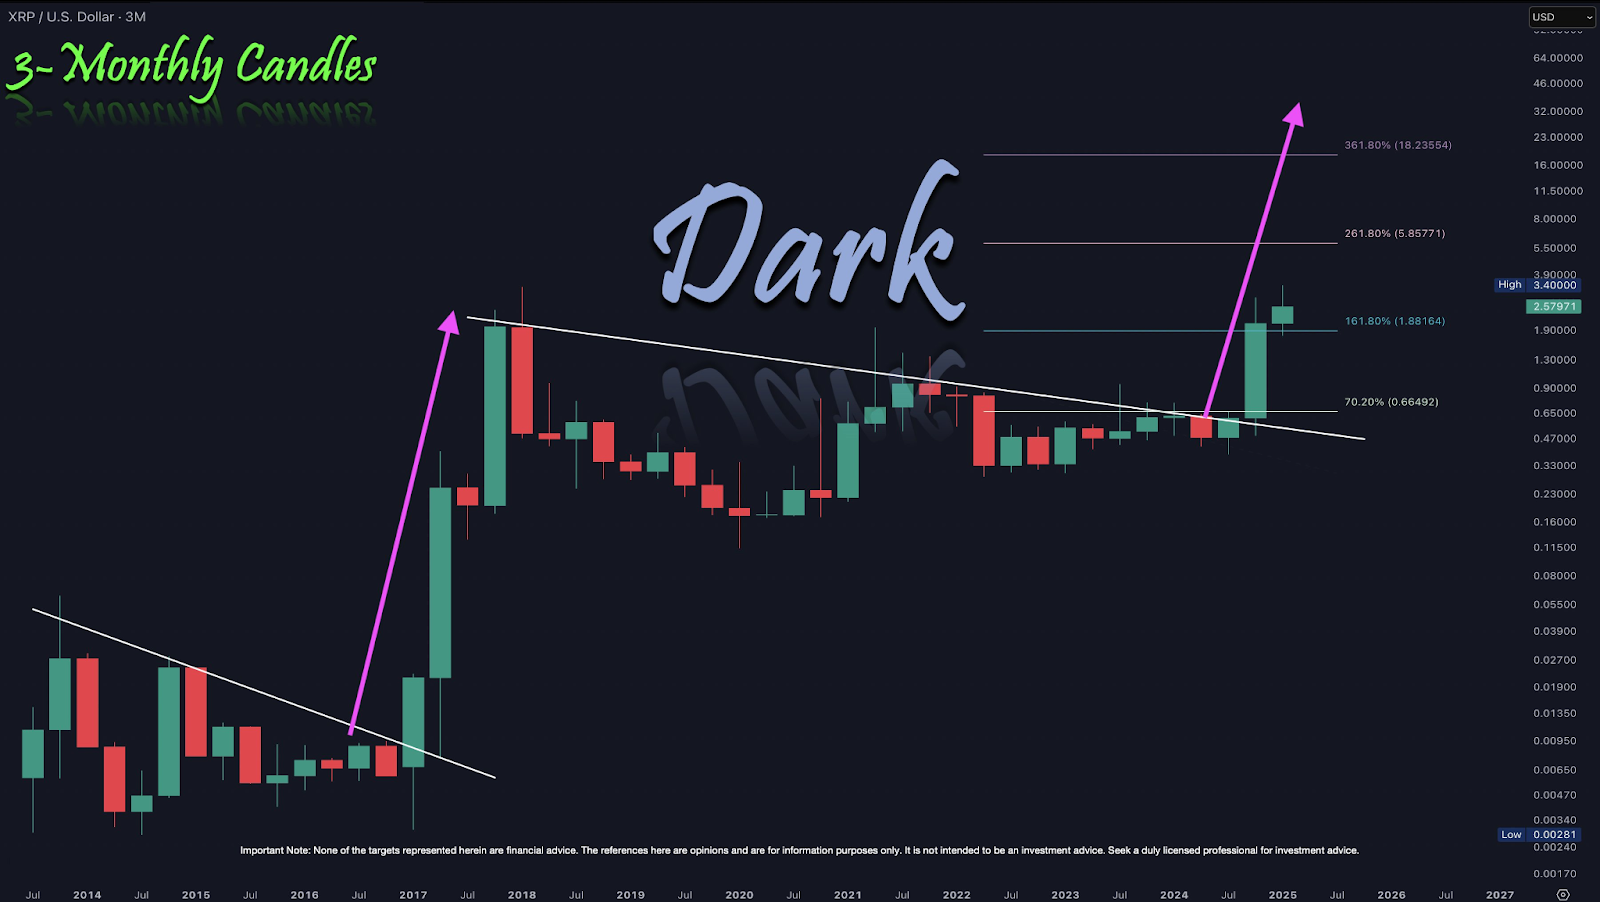 XRP price analysis chart. Source: Dark Defender
Beyond technical factors, regulatory developments could influence XRP’s price. With a more crypto-friendly administration, the XRP community anticipates the Securities Exchange Commission (SEC) may seek a resolution in its legal battle with Ripple, potentially through case dismissal or a favorable settlement.
Meanwhile, the focus has also shifted to the SEC’s review of a spot XRP exchange-traded fund (ETF) after the regulator acknowledged receiving applications on February 14. A decision is expected by October 2025.
XRP price analysis
At the time of reporting, XRP was trading at $2.58, down over 3% in the last 24 hours but up 3.4% on the weekly timeframe.
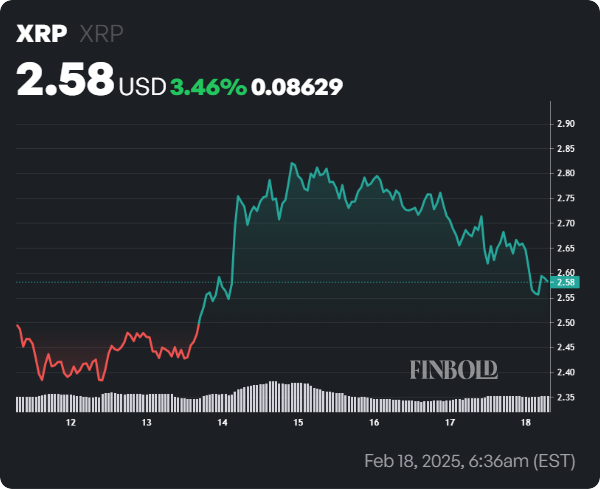 XRP seven-day price chart. Source: Finbold
Currently, sentiment around XRP remains largely bearish. The asset shows signs of extended losses in the short term as the price hovers below the 50-day simple moving average (SMA) of $2.66. However, in the long term, sentiment remains bullish, given that XRP’s current price is comfortably above the 200-day SMA at $1.39.
A review of momentum indicators such as the Relative Strength Index (RSI) points to neutrality. A reading of 49 indicates that XRP is neither overbought nor oversold, while volatility remains elevated at 10.81%.
Featured image via Shutterstock